
BUSINESS
Crop Tour Finds Indiana and Nebraska Corn Yields Lagging 2025
Pro Farmer Day 2 pegs Indiana corn at 183.54 and Nebraska at 163.61 bushels, both down from 2025.

Pro Farmer Crop Tour scouts measured Indiana corn yield potential at 183.54 bushels per acre on Day 2, down 5.3% from 193.82 last year, while Nebraska came in at 163.61, an 8.9% drop from 179.50. Soybean pod counts fell in both states too, leaving a sharper gap with last week’s USDA state forecasts than many expected.
The four-day tour’s second day covered eastern Indiana into Illinois and much of Nebraska. Those readings sit well below the three-year Tour averages and point to heat stress and excess rain carving uneven holes that statewide averages smooth over.
The pattern is not a single weather story. Heat on the western leg and saturation on the eastern leg cut yield potential in different ways, yet both pushed Tour samples further under the August USDA state numbers. That double pressure is what sharpened the gap traders and private analysts were already watching.
Day 2 Tallies Trail 2025 Across Both Legs
Scouts pulled hundreds of samples. Indiana’s full-state corn average landed at 183.54 bushels after 181 stops, with ear counts at 101.59 and grain length 6.78 inches. That sits 2.1% under the three-year Tour mark of 187.42. Nebraska’s 323 corn samples averaged 163.61, ear count 86.22, with irrigated fields still showing tipback.
| State / Metric | 2026 Tour | 2025 Tour | 3-yr Tour avg | USDA Aug |
|---|---|---|---|---|
| Indiana corn (bu/ac) | 183.54 | 193.82 | 187.42 | 206 |
| Nebraska corn (bu/ac) | 163.61 | 179.50 | 173.32 | 183 |
| Indiana soy pods (3×3) | 1,318.64 | 1,376.59 | 1,365.19 | 62 bu yield |
| Nebraska soy pods (3×3) | 1,219.62 | 1,348.31 | 1,226.94 | 57 bu yield |
The Indiana corn yield potential of 183.54 bu and matching pod data come straight from Pro Farmer’s official district tables. Nebraska’s figures follow the same method. USDA’s August Crop Production report had Indiana corn at a record 206 bushels and Nebraska at 183. Tour organizers note they never match USDA one-for-one; direction of travel still matters.
Read side by side, the corn gaps are wide on both legs. Indiana Tour corn trails the USDA August figure by a large margin, and Nebraska’s Tour average trails its USDA number as well. Soy pods tell a softer story against their three-year Tour marks, which is why bean potential still draws a more open reading than corn.
| Comparison | Indiana | Nebraska |
|---|---|---|
| Corn vs 2025 Tour | Down 5.3% | Down 8.9% |
| Corn vs 3-yr Tour avg | Down 2.1% | Below 173.32 avg |
| Soy pods vs 2025 Tour | Down 4.2% | Down 9.5% |
| Soy pods vs 3-yr Tour avg | Down 3.4% | Down 0.6% |
Sample size backs the tone. Hundreds of stops across two states leave little room to dismiss the direction, even if final harvest monitors will still sort field-level winners from losers.
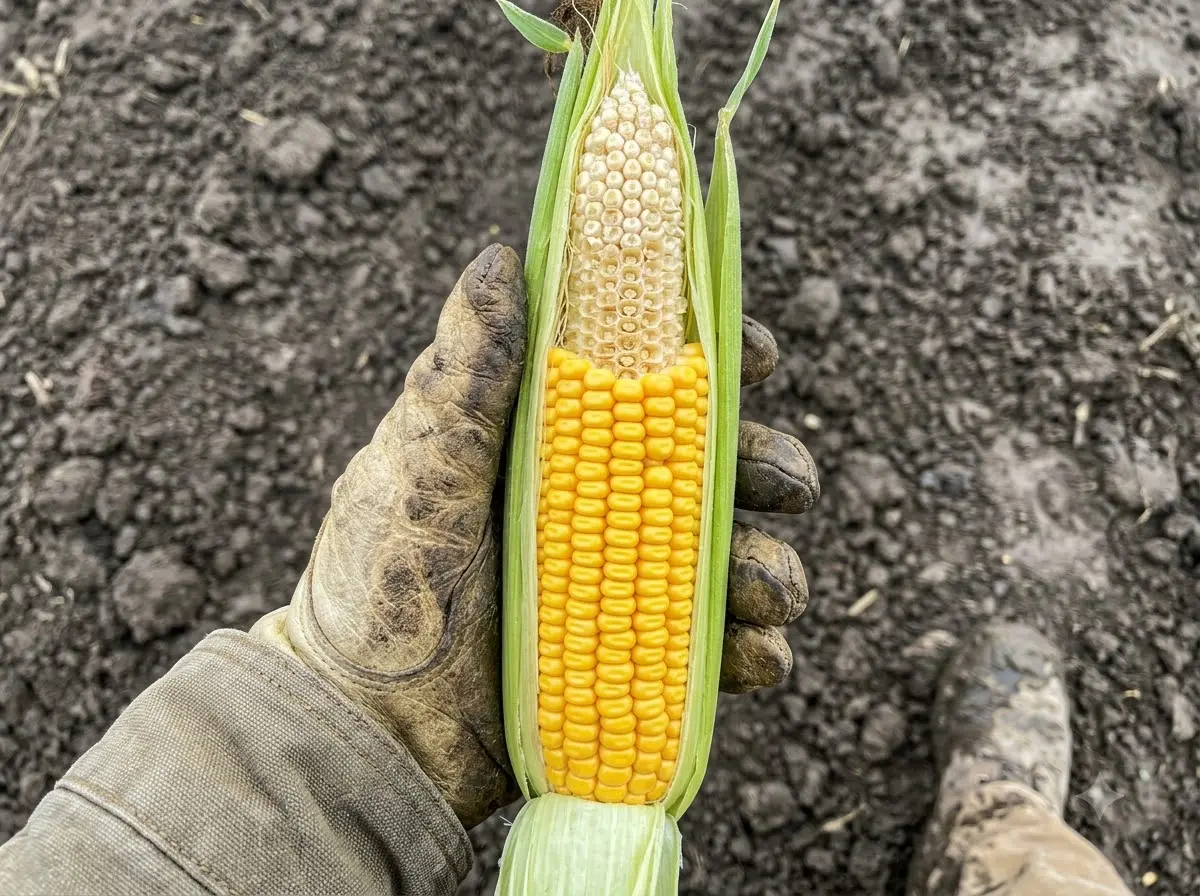
Warm July Nights Left Tipback Even on Irrigated Corn
Western-leg scouts kept running into the same ear problem. Brent Judisch, a 14-year Tour consultant, said tipback was hard to shake on irrigated samples across Hamilton, York, Saline and Fillmore counties. He tied it to a stretch of overnight lows that never dropped below 70 degrees in July.
You can overcome dry with irrigation, but you can’t overcome heat.
Western Tour leader Chip Flory said the same thing on AgriTalk after seeing shotgun pollination on some cobs, kernels filling only two-thirds of the ear. Ear populations sat 5.2% under last year and the three-year average. Preliminary routes showed wide ranges: one crew averaged 178 bushels with stops from 145 to 213; an all-irrigated route hit 193.54. Dryland pulled the state number down.
That spread inside Nebraska matters as much as the state average. Irrigated stops could still post solid numbers, yet tipback trimmed potential even where water was not the limit. Dryland acres then dragged the full-state figure lower, which is how a mixed field tour lands well under both last year and the three-year Tour mark.
Disease stayed light. Northern leaf blight and a bit of tar spot appeared, but nothing alarming. Hail damage stayed localized. Maturity sat at early dent for much of the crop, a touch ahead of ideal after the heat push. The Nebraska Tour corn at 163.61 reflects that ear-count hit more than grain length or kernel rows.
In short, the western leg was an ear-count and tipback story first. Kernel rows and grain length were not the main drag. Fewer harvestable ears, and ears that failed to fill to the tip, set the ceiling before scouts ever averaged the stops.
Saturated Indiana Showed Pollination Gaps and Wet Spots
Eastern scouts expected deep mud after a one-in-a-thousand-year rain event the prior week. They found less standing water than feared in many fields, yet the crop still told a stressed story. Lane Akre, eastern Tour leader, reported corn farther along than expected, with some ears already denting, plus pollination issues on roughly a third of ears in a third of samples.
- Northern leaf blight the main disease, heavier than Day 1
- Localized flooding, including entire plants underwater near Eugene, Indiana
- Goosenecked stalks and light weed pressure in spots
- Sudden death syndrome appearing farther west into Illinois
- Japanese beetles chewing leaves; one severe corn-smut field
- Ear counts down and yields starting low in the east before improving westward
Akre’s own early stops averaged near 140 bushels before later western Indiana samples topped 200. Kyle Wendlund’s mixed Indiana-Illinois route put Indiana corn at 182.01 and Illinois at 177.65. Beans looked better than corn overall, with solid pod counts in places, though maturity and pod size varied widely even inside single fields. Agronomist Missy Bauer told the livestream that saturated soils enlarge wet spots that will read as zero-yield zones on harvest monitors and can starve nitrogen if rescue applications never came.
The east-to-west climb inside Indiana shows how uneven the damage is. Early eastern stops near 140 bushels and later samples above 200 can average into a mid-180s state figure while still hiding pockets that harvest equipment will score as zeros. Pollination gaps on a share of ears compound that risk where stands looked complete from the road.
Disease and insects added noise without rewriting the plot. Northern leaf blight ran heavier than on Day 1, sudden death syndrome showed farther west into Illinois, and Japanese beetles plus one severe corn-smut field marked local trouble. None of those replaced water and pollination as the main eastern limits.
Irrigated Fields Hold While Dryland and Zeros Drag Averages
The split inside each state is the second-order story. Irrigated Nebraska corn still looked “average” to Judisch, yet tipback cut 8 to 12% off potential. Dryland acres, which nearly matched irrigated last year, fell off harder this season. Soybean irrigated pods sat near normal around 1,600 in some checks; dryland and the state average sat lower.
Key Day 2 pressure points:
- NE ear count 86.22, lowest tone since at least 2013 per scout chatter and down 5.2% year over year
- IN grain length 6.78 inches, 3.9% under 2025
- NE soy pods down 9.5% from last Tour, nearly flat to three-year average
- IN soy pods down 4.2%, with higher soil moisture readings than 2025
USDA’s Nebraska corn forecast at 183 bushels already priced in an 11-bushel drop from 194 last year. Tour data suggest the dryland drag and remaining August heat risk could keep pressure on. Indiana’s USDA 206 looks harder to reach if eastern wet spots and pollination gaps stick. Michael Cordonnier, a Pro Farmer consultant, cut his U.S. corn yield estimate one bushel to 180.0 and soybeans half a bushel to 51.5 on Monday, citing the double-edged storms that helped dry western areas while flooding the east.
Irrigation drew a floor under some Nebraska corn and bean checks, but it did not erase July heat. Tipback of 8 to 12% on irrigated ears shows why “average” looking fields can still land below last year’s Tour pace. On the eastern leg, zero-yield wet spots work the same math from the opposite direction: good ground carries the average until harvest monitors punch out the drowned corners.
Soybean Pods Leave Room if August Weather Cooperates
Pod counts are potential, not yield. Ted Seifried of Zaner Ag Hedge noted after Day 1 that recent years ran high pods that August weather never fully filled. Nebraska pods this year sit only 0.6% under the three-year average even after the 9.5% drop from 2025’s big number. Indiana sits 3.4% under its three-year mark. Scouts said beans handled the rain better than feared in many spots, finished flowering, and still had moisture to fill. Flory said August rains could still lift Nebraska beans meaningfully. Akre called Indiana beans better than corn so far, with short-stature plants and wide variability but real upside if it dries out enough to limit white mold and keep roots healthy.
That runway is why private and Tour-linked voices treat the bean side as less settled than corn. Disease and insect pressure stayed modest on both legs. The bigger risks remain standing-water death zones and any late heat or drought that stops seed fill.
Compared with corn, the bean file still hinges on weather that has not finished. Pod counts near the three-year Tour averages leave fill as the open variable. Corn’s ear-count and tipback damage is already locked into many samples; soybeans still need a clean finish to turn today’s pod potential into bushels.
How the East West Weather Split Shows Up
Day 2 put two stress patterns on the same tour map. Nebraska’s problem was heat that irrigation could not fully offset, visible as tipback, shotgun pollination, and an ear count of 86.22. Indiana’s problem was water that left pollination gaps, goosenecked stalks, and wet spots that may score as zeros later.
Those mechanisms feed the same headline direction for different reasons:
- Western corn lost ear fill and ear population after warm July nights
- Eastern corn lost stand uniformity and pollination after extreme rain
- Beans on both legs kept more pod potential relative to their three-year Tour marks
- Private cuts, including Cordonnier’s move to 180.0 corn and 51.5 soybeans, already track that split
Statewide averages blur the holes. A Nebraska irrigated route at 193.54 and a dryland drag on the state figure can live in the same data set. An Indiana path from roughly 140 bushel early stops to samples above 200 does the same. Tour day totals capture both the good ground and the damage; they do not erase either.
Futures Already Trading the Fragmentation
December corn turned lower Tuesday after early gains, sitting near $4.88½ by midday comments, while November soybeans held a 7-cent gain near $12.23 after China buying, tight soyoil stocks and biofuel demand supported the complex. Day 1’s soft South Dakota and Ohio numbers had already lifted prices overnight. The Indiana-Nebraska contrast keeps the same theme: Tour direction lower than last year, USDA still higher in the east, private cuts starting.
Pro Farmer will release its own national production estimates Friday after the full tour. Those adjust Tour samples for maturity, outside areas and the long-run Tour-versus-USDA bias. Over decades the Tour has tended to run a couple bushels under final USDA corn yields on average, yet year-to-year direction and the size of the miss still move the board when weather is this split.
Price action already separates the two crops. Corn gave back early strength once Day 2 confirmed softer Tour potential against last year. Soybeans held a gain on demand and product support even as pod counts cooled from 2025. That split matches the agronomy: corn damage looks more baked in, while bean fill still depends on August.
Friday Estimates Will Test the Tour Signal
Friday’s national Pro Farmer figures will not simply average the roadside stops. Organizers adjust samples for maturity, for production areas the tour does not walk, and for the long-run tendency of Tour corn to run a couple bushels under final USDA yields. Direction still counts when the miss is large and the weather map is fractured.
Cordonnier’s one-bushel corn cut to 180.0 and half-bushel soybean cut to 51.5 already sketch how private sheets may lean before Friday. USDA’s Indiana 206 and Nebraska 183 remain the official state benchmarks Tour readers are testing. If eastern wet spots and western tipback hold through the Illinois and Iowa legs, the gap between Tour tone and those August forecasts stays in play.
The open questions are narrow and concrete:
- Day 1: Soft South Dakota and Ohio numbers set a lower early tone
- Day 2: Indiana at 183.54 and Nebraska at 163.61 confirmed year-over-year corn declines
- Next legs: Illinois and Iowa samples test whether western improvement continues
- Friday: Pro Farmer national estimates fold maturity and bias adjustments into a full production call
Scouts move into Illinois and Iowa next. The method itself stays open: walk 25 paces past end rows, stake a 30-foot plot, count ears, pull three systematic ears for length and rows, then calculate. Anyone can copy how Crop Tour scouts sample fields and send results to the editors. The remaining samples will show whether western improvement continues and whether Nebraska’s latest rains buy the beans enough time. Harvest monitors will settle the wet-spot and tipback arguments later this fall.


Spotify Running Mode hits Android and revives its old tempo experiment

Galaxy Tab S12 Ultra Renders Keep the Notch Fans Hate

Novato Spinning Round House Sells With Six Neighbors for $3.3 Million

Crop Tour Finds Indiana and Nebraska Corn Yields Lagging 2025

Best Buy 60th sale brings Android deals back to its roots

American Airlines reverses seatback screen bet years too late

Iran Hormuz Strikes Force Gulf Oil Onto Costlier Paths

Plague Tale Prequel Day One Joins Game Pass Wave 2 as Witcher Exits

NBA 2K27 opens The City to everyone and rewrites career eras

iOS 26.6.1 Patches 29 Flaws as AI Forces Faster Apple Updates

Caitlin Clark Skips the WNBA 3-Point Contest for a Third Straight Year

Rainout Gives Red Sox Two Shots at a Franchise-Record Win Streak

Double Fine Cuts 23 Jobs Weeks After Xbox Independence

Day-One Big Walk Lifts PS Plus August Beyond Recycled AAA

John Hight Exits Wizards After Digital Reckoning Hits

Curtis Mead’s Red Sox Debut Ends With Fractured Wrist

Moesch and Dressel Rewrite Night One at 2026 U.S. Nationals

Red Sox Squander Hot Streak Chance in 4-3 Loss to Athletics

Boutte’s Quiet Camp Takeover Forces Patriots Receiver Choices

Take-Two CEO Pushes Netflix Subs for GTA 6 Extended Look
-

 TECHNOLOGY3 years ago
How to Adjust a Bulova Watch Band – An Easy Guide
-

 News3 years ago
Fred Pentland: Athletic Bilbao’s English mentor who changed the essence of Spanish football
-

 FINANCE3 years ago
Tax Planning for Every Season: Guide to Maximizing Your Tax Benefits
-

 Education3 years ago
African Ministers New Education Plan
-

 BUSINESS3 years ago
What is Entrepreneurial Operating System? A Comprehensive Guide to EOS
-

 Education3 years ago
Innovate Your Learning Journey with Technology and Enhance Education
-

 BUSINESS3 years ago
Top 9 Most Expensive American Cities to Rent an Apartment
-

 News3 years ago
Russians formally out of World Athletics Championships