
FINANCE
Iran War Pushes Fed’s Preferred Inflation Gauge to Three-Year High

The Federal Reserve’s preferred inflation gauge climbed to a three-year high in April, with the personal consumption expenditures (PCE) price index up 3.8% year over year, the Commerce Department said Thursday. Headline prices rose 0.4% from March, a step down from the 0.7% monthly print one month earlier but still well above the central bank’s 2% goal, and the slowdown owes more to a base effect in the math than to any easing of pressure on the ground.
Core PCE, which strips out food and energy, rose 0.2% on the month and 3.3% from a year ago, ticking up from 3.2% in March. That core line is the one the Fed watches when it has to call a meeting. The Iran war’s oil shock is now visible in the line items, and rate-cut odds for the rest of the year moved with it.
The April Print That Locked the Pause
The deceleration in monthly headline prices, from 0.7% in March to 0.4% in April, looks helpful at first glance. The composition is narrower than the headline suggests. Gasoline did the bulk of the work pushing March’s number into peak territory when the first wave of oil-price pass-through hit retail pumps, and April’s smaller move reflects a fading base effect, not the broad disinflation the Federal Reserve needs to see before it can move on rates.
Headline annual PCE actually accelerated, climbing to 3.8% from 3.5% one month earlier. That is the highest annual reading since spring 2023, the last leg of the post-pandemic inflation surge. Core’s quarter-percentage-point year-on-year tick up tells the same story in cleaner form: the energy spike is starting to seep into prices the Fed normally treats as the underlying signal.
The release reset rate expectations before the New York cash open.
- 3.8% headline PCE annual, the hottest reading since spring 2023
- 3.3% core PCE annual, up from 3.2% in March and well above the 2% target
- 2.6% personal saving rate, the lowest level since June 2022
- $111.1 billion April rise in nominal consumption outlays, with fuel, utilities, housing, and food accounting for roughly half of the lift
Fed funds futures trimmed the probability of a July reduction and pulled the first fully priced cut into the fourth quarter. Two-year Treasury yields, the part of the curve most sensitive to near-term policy, ticked higher in the minutes after the data hit.
Gasoline Carried the Number
The energy line is where the Iran war stops being a foreign-news story and becomes a Fed story. Brent crude has held above $80 for most of the quarter and is up more than 40% from levels prevailing before the coordinated strikes on Iranian targets. The International Energy Agency has called the supply hit the largest disruption in the history of the global oil market.
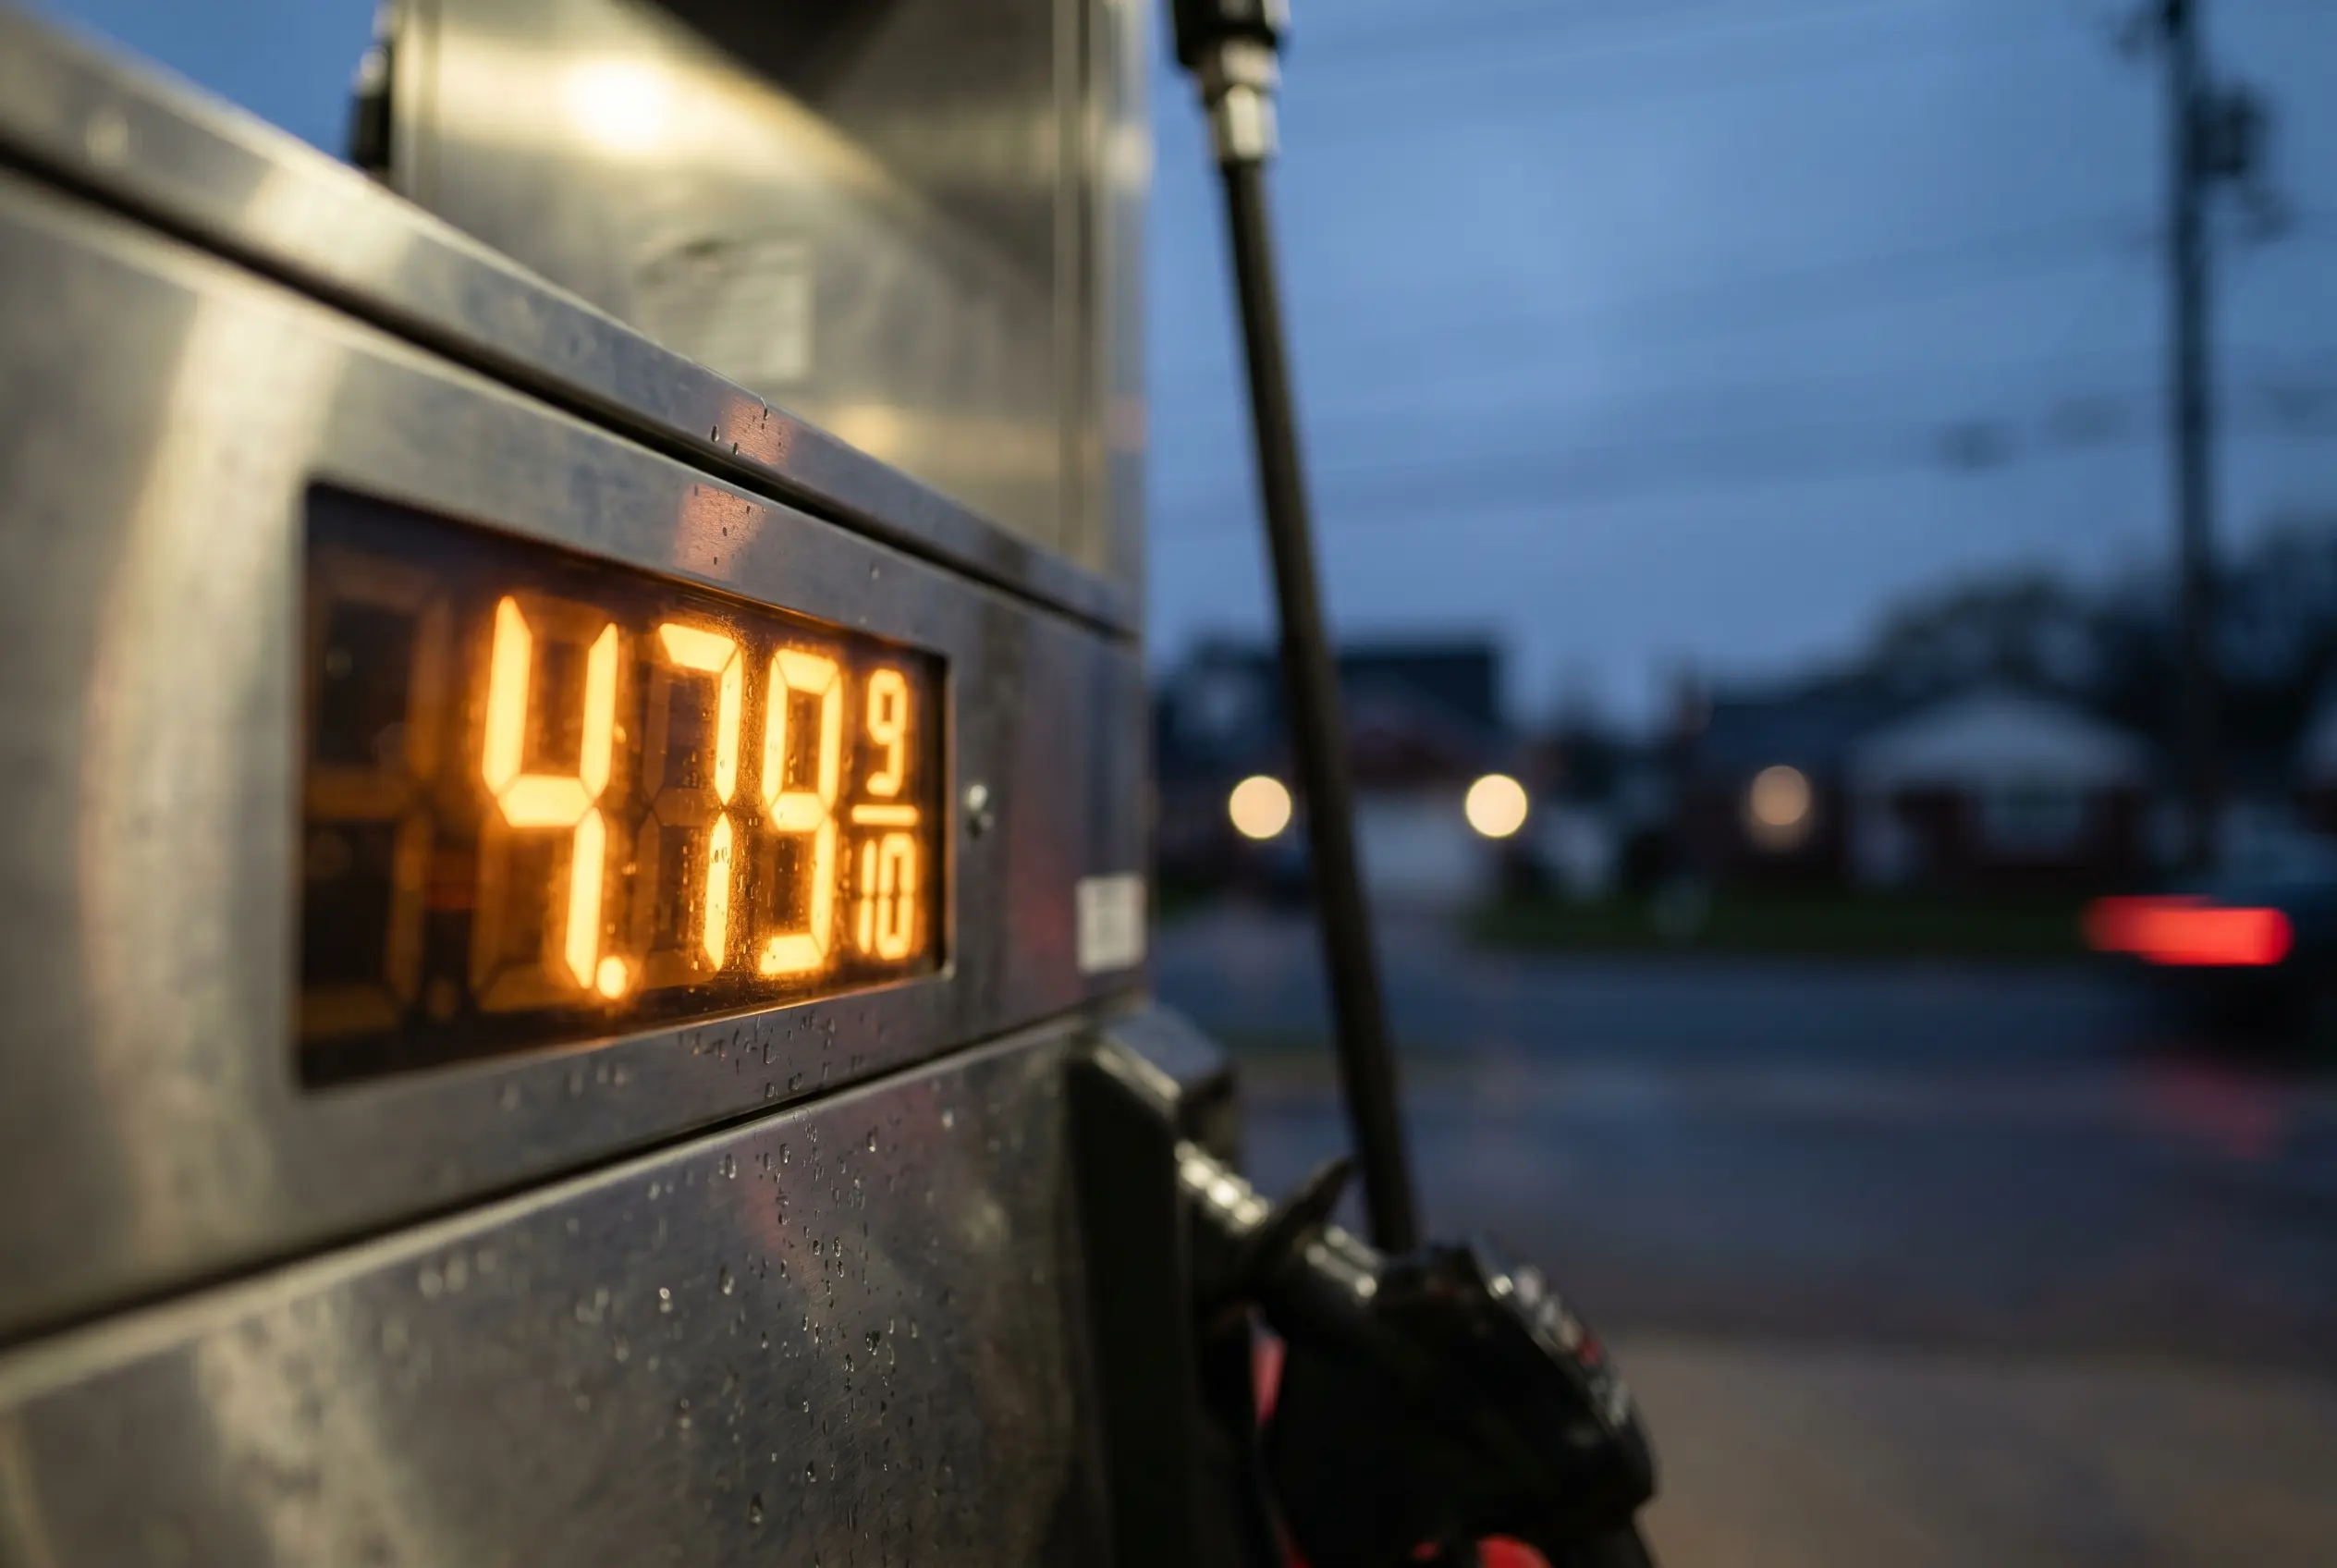
At the pump, the pass-through is already done. The national average for regular gasoline crossed $4 a gallon during April, a roughly 30% jump tied to the war, and that move alone explains much of the gap between core and headline readings on a monthly basis. Vitol chief executive Russell Hardy told a London industry briefing on April 21 that the war had taken between 600 and 700 million barrels of production out of global supply, with a full-year loss likely to top one billion barrels.
The contrast between March and April makes the energy story easier to read.
| Metric | March 2026 | April 2026 |
|---|---|---|
| Headline PCE, monthly change | +0.7% | +0.4% |
| Headline PCE, annual change | +3.5% | +3.8% |
| Core PCE, annual change | +3.2% | +3.3% |
| Personal saving rate | 3.2% | 2.6% |
The monthly headline slowed; every annual measure either rose or held at an elevated level. Asia opened the next session in red, with regional indices selling off on a fresh round of Middle East headlines that piled onto the inflation signal. Coverage of the Asia-Pacific selloff tied to renewed US strikes showed Korea’s small-cap Kosdaq logging the steepest single-day move on any major regional index, with crude curves repricing in tandem.
Households Are Burning Their Cushion
The data point underneath the price index that worries Fed staff most is the saving rate. At 2.6% in April, it is the lowest reading since June 2022, when post-pandemic consumption was still drawing down stimulus balances. The current draw-down has a different cause: real disposable income fell by 0.1% on the month, and households are dipping into savings to keep buying the same basket of essentials at higher prices.
Personal income was essentially flat, slipping by less than 0.1% as a drop in farm proprietors’ income offset a small gain in compensation. With nominal spending up $111.1 billion and income unchanged, the math forces savings down. The split is uncomfortable when you look at where the money is going.
- Fuel and energy services posted the sharpest month-over-month price gains in any major category
- Housing and utilities contributed an outsized share of nominal-spending growth, with rent and electricity both rising
- Food at home held its monthly pace, even as some grain and protein subcategories continued to ease
- Discretionary goods, particularly autos and electronics, slowed sharply, a signal of consumer trade-down
Mortgage costs are pinning the household budget from the other side. The average 30-year fixed crossed 6.53% in the week ending May 28, a nine-month high, driven by the same back-up in Treasury yields that the PCE print just reinforced. Refinances have collapsed, and home-equity lines that smoothed consumption during the 2024-25 disinflation are no longer the safety valve they were.
Why the Iran Premium Will Linger
Research out of the Dallas Federal Reserve published in April laid out the most-cited scenario range for how long the oil shock keeps biting. The paper, written before the latest escalation in early May, modeled three paths depending on the duration and severity of the supply disruption, and each of them keeps the Fed’s preferred gauge above target through the end of the year.
| Iran War Scenario | 2026 Q4/Q4 Headline PCE Impact | Core PCE Impact |
|---|---|---|
| Plausible, short-duration disruption | +0.6 percentage points | Minimal |
| Strait of Hormuz partially blocked, three quarters | +1.1 percentage points | +0.3 percentage points |
| Severe 20% global oil shortfall, three quarters | +1.8 percentage points | +0.4 percentage points |
Two months into the conflict, the realized path is tracking somewhere between scenarios one and two. The April PCE print is consistent with the middle path beginning to show up in the data, and the core tick-up from 3.2% to 3.3% on an annual basis suggests pass-through is no longer confined to fuel.
The near-term effect of higher oil and gas prices will be to lift inflation. The question is whether households and businesses come to expect that those increases will continue, and that is what we are watching most closely.
That framing came from outgoing Federal Reserve chair Jerome Powell at his post-FOMC press conference on April 29, when the Committee held the target range at 3.50% to 3.75%. The line set the bar for what would change his mind: not the oil price itself, but evidence that the public has begun to bake the higher prices into wage demands and pricing decisions. The April PCE report did not deliver that evidence, but it did not rule it out either.
The CEPR’s quantification work, published in early May, used a different model class and reached a similar conclusion. Oil-driven shocks of this size tend to add between 0.4 and 1.2 percentage points to headline inflation across a four-quarter window, with most of the impact concentrated in the first two quarters after the shock begins.
From Powell to Warsh, With Inflation as the Handoff
The April PCE report is the last one Powell will see as chair. His term ends ahead of the FOMC meeting on June 16-17, and Kevin Warsh, the former Fed governor confirmed by the Senate this spring, will preside in his place. Warsh inherits a balance sheet still in modest run-off, a policy rate three quarters of a point above what the dot plot pencilled in for year-end, and an inflation print that just moved away from him before he sat in the chair.
Warsh’s public commentary across the spring has been more hawkish than the Powell consensus, particularly on the question of how the Fed should respond to supply shocks. His March speech at the Hoover Institution argued that the central bank had under-weighted second-round effects during the 2021-22 cycle and should not repeat the mistake. Markets read that as a signal that a Warsh Fed will keep rates higher for longer if the war’s price effects bleed into wages or services inflation.
The handoff matters because the June meeting will release a fresh Summary of Economic Projections, the quarterly document that prints each policymaker’s rate forecast. The March SEP carried a median of one cut for 2026; the next one almost certainly will not, given the trajectory of the PCE data and the unresolved status of the oil disruption. A median forecast of zero cuts would be the formal acknowledgment that the inflation reckoning from the war is now base case, not a tail risk.
The recent Brent move above $108 on the latest Trump ultimatum to Tehran shows how quickly the oil curve can reprice on a single headline, and how little control the Fed has over the input that is currently doing the most damage to its mandate.
Where the June Meeting Sits Now
The June 17 decision will be set against a tight window of data. The May consumer price index lands on June 11, the producer price index on June 12, and the May retail sales report on June 17 itself, just hours before the FOMC statement. A May CPI that confirms the April PCE direction will harden the case for an extended hold; one that surprises lower would re-open a July conversation that is currently shut.
The harder question for Warsh is the saving rate, not the price level. At 2.6%, the cushion that has absorbed two years of above-target inflation is nearly gone. Consumer spending growth into the third quarter will increasingly depend on real wage gains rather than balance-sheet draw-down, and real wages are being squeezed by exactly the energy line that is driving the PCE number above target. Either oil reverses, or the consumer slows; the Fed’s path bends on which one comes first.
If Brent eases back toward $70 over the summer as IEA forecasters expect under a partial resolution, the September meeting opens up as a live cut window. If oil holds near $80 or pushes higher on a fresh escalation, the pause stretches into the fourth quarter, and the calendar runs out on a 2026 cut altogether.






Spotify Running Mode hits Android and revives its old tempo experiment

Galaxy Tab S12 Ultra Renders Keep the Notch Fans Hate

Novato Spinning Round House Sells With Six Neighbors for $3.3 Million

Crop Tour Finds Indiana and Nebraska Corn Yields Lagging 2025

Best Buy 60th sale brings Android deals back to its roots

American Airlines reverses seatback screen bet years too late

Iran Hormuz Strikes Force Gulf Oil Onto Costlier Paths

Plague Tale Prequel Day One Joins Game Pass Wave 2 as Witcher Exits

NBA 2K27 opens The City to everyone and rewrites career eras

iOS 26.6.1 Patches 29 Flaws as AI Forces Faster Apple Updates

Double Fine Cuts 23 Jobs Weeks After Xbox Independence

Day-One Big Walk Lifts PS Plus August Beyond Recycled AAA

John Hight Exits Wizards After Digital Reckoning Hits

Curtis Mead’s Red Sox Debut Ends With Fractured Wrist

Red Sox Squander Hot Streak Chance in 4-3 Loss to Athletics

Moesch and Dressel Rewrite Night One at 2026 U.S. Nationals

Boutte’s Quiet Camp Takeover Forces Patriots Receiver Choices

Take-Two CEO Pushes Netflix Subs for GTA 6 Extended Look

Halo Campaign Evolved Skulls Meet Death Barriers That Kill the Hunt

Wildlands Free Update Hands Players the Tools They Already Invented
-

 TECHNOLOGY3 years ago
How to Adjust a Bulova Watch Band – An Easy Guide
-

 News3 years ago
Fred Pentland: Athletic Bilbao’s English mentor who changed the essence of Spanish football
-

 FINANCE3 years ago
Tax Planning for Every Season: Guide to Maximizing Your Tax Benefits
-

 Education3 years ago
African Ministers New Education Plan
-

 BUSINESS3 years ago
What is Entrepreneurial Operating System? A Comprehensive Guide to EOS
-

 Education3 years ago
Innovate Your Learning Journey with Technology and Enhance Education
-

 News3 years ago
Russians formally out of World Athletics Championships
-

 BUSINESS3 years ago
Top 9 Most Expensive American Cities to Rent an Apartment