
News
Waves Redraw the Antarctic Marginal Ice Zone, Radar Shows

For decades, the Antarctic marginal ice zone was mapped by a satellite shortcut that had little to do with the force that defines it: ocean waves. A decade-long wave-in-ice record, published in Nature Communications, now measures the zone by the waves that break the ice, and finds about 16% of Antarctica’s sea-ice cover is wave-affected, widest in winter rather than summer.
The correction matters more than it sounds. The old yardstick set the boundaries of a region that drives the exchange of heat and carbon between the Southern Ocean and the sky, shelters the ice shelves behind it, and feeds the food web that sustains krill, penguins and whales. It also sits at the leading edge of a sea-ice collapse that has unsettled polar scientists since 2016.
What the Old Definition Got Wrong
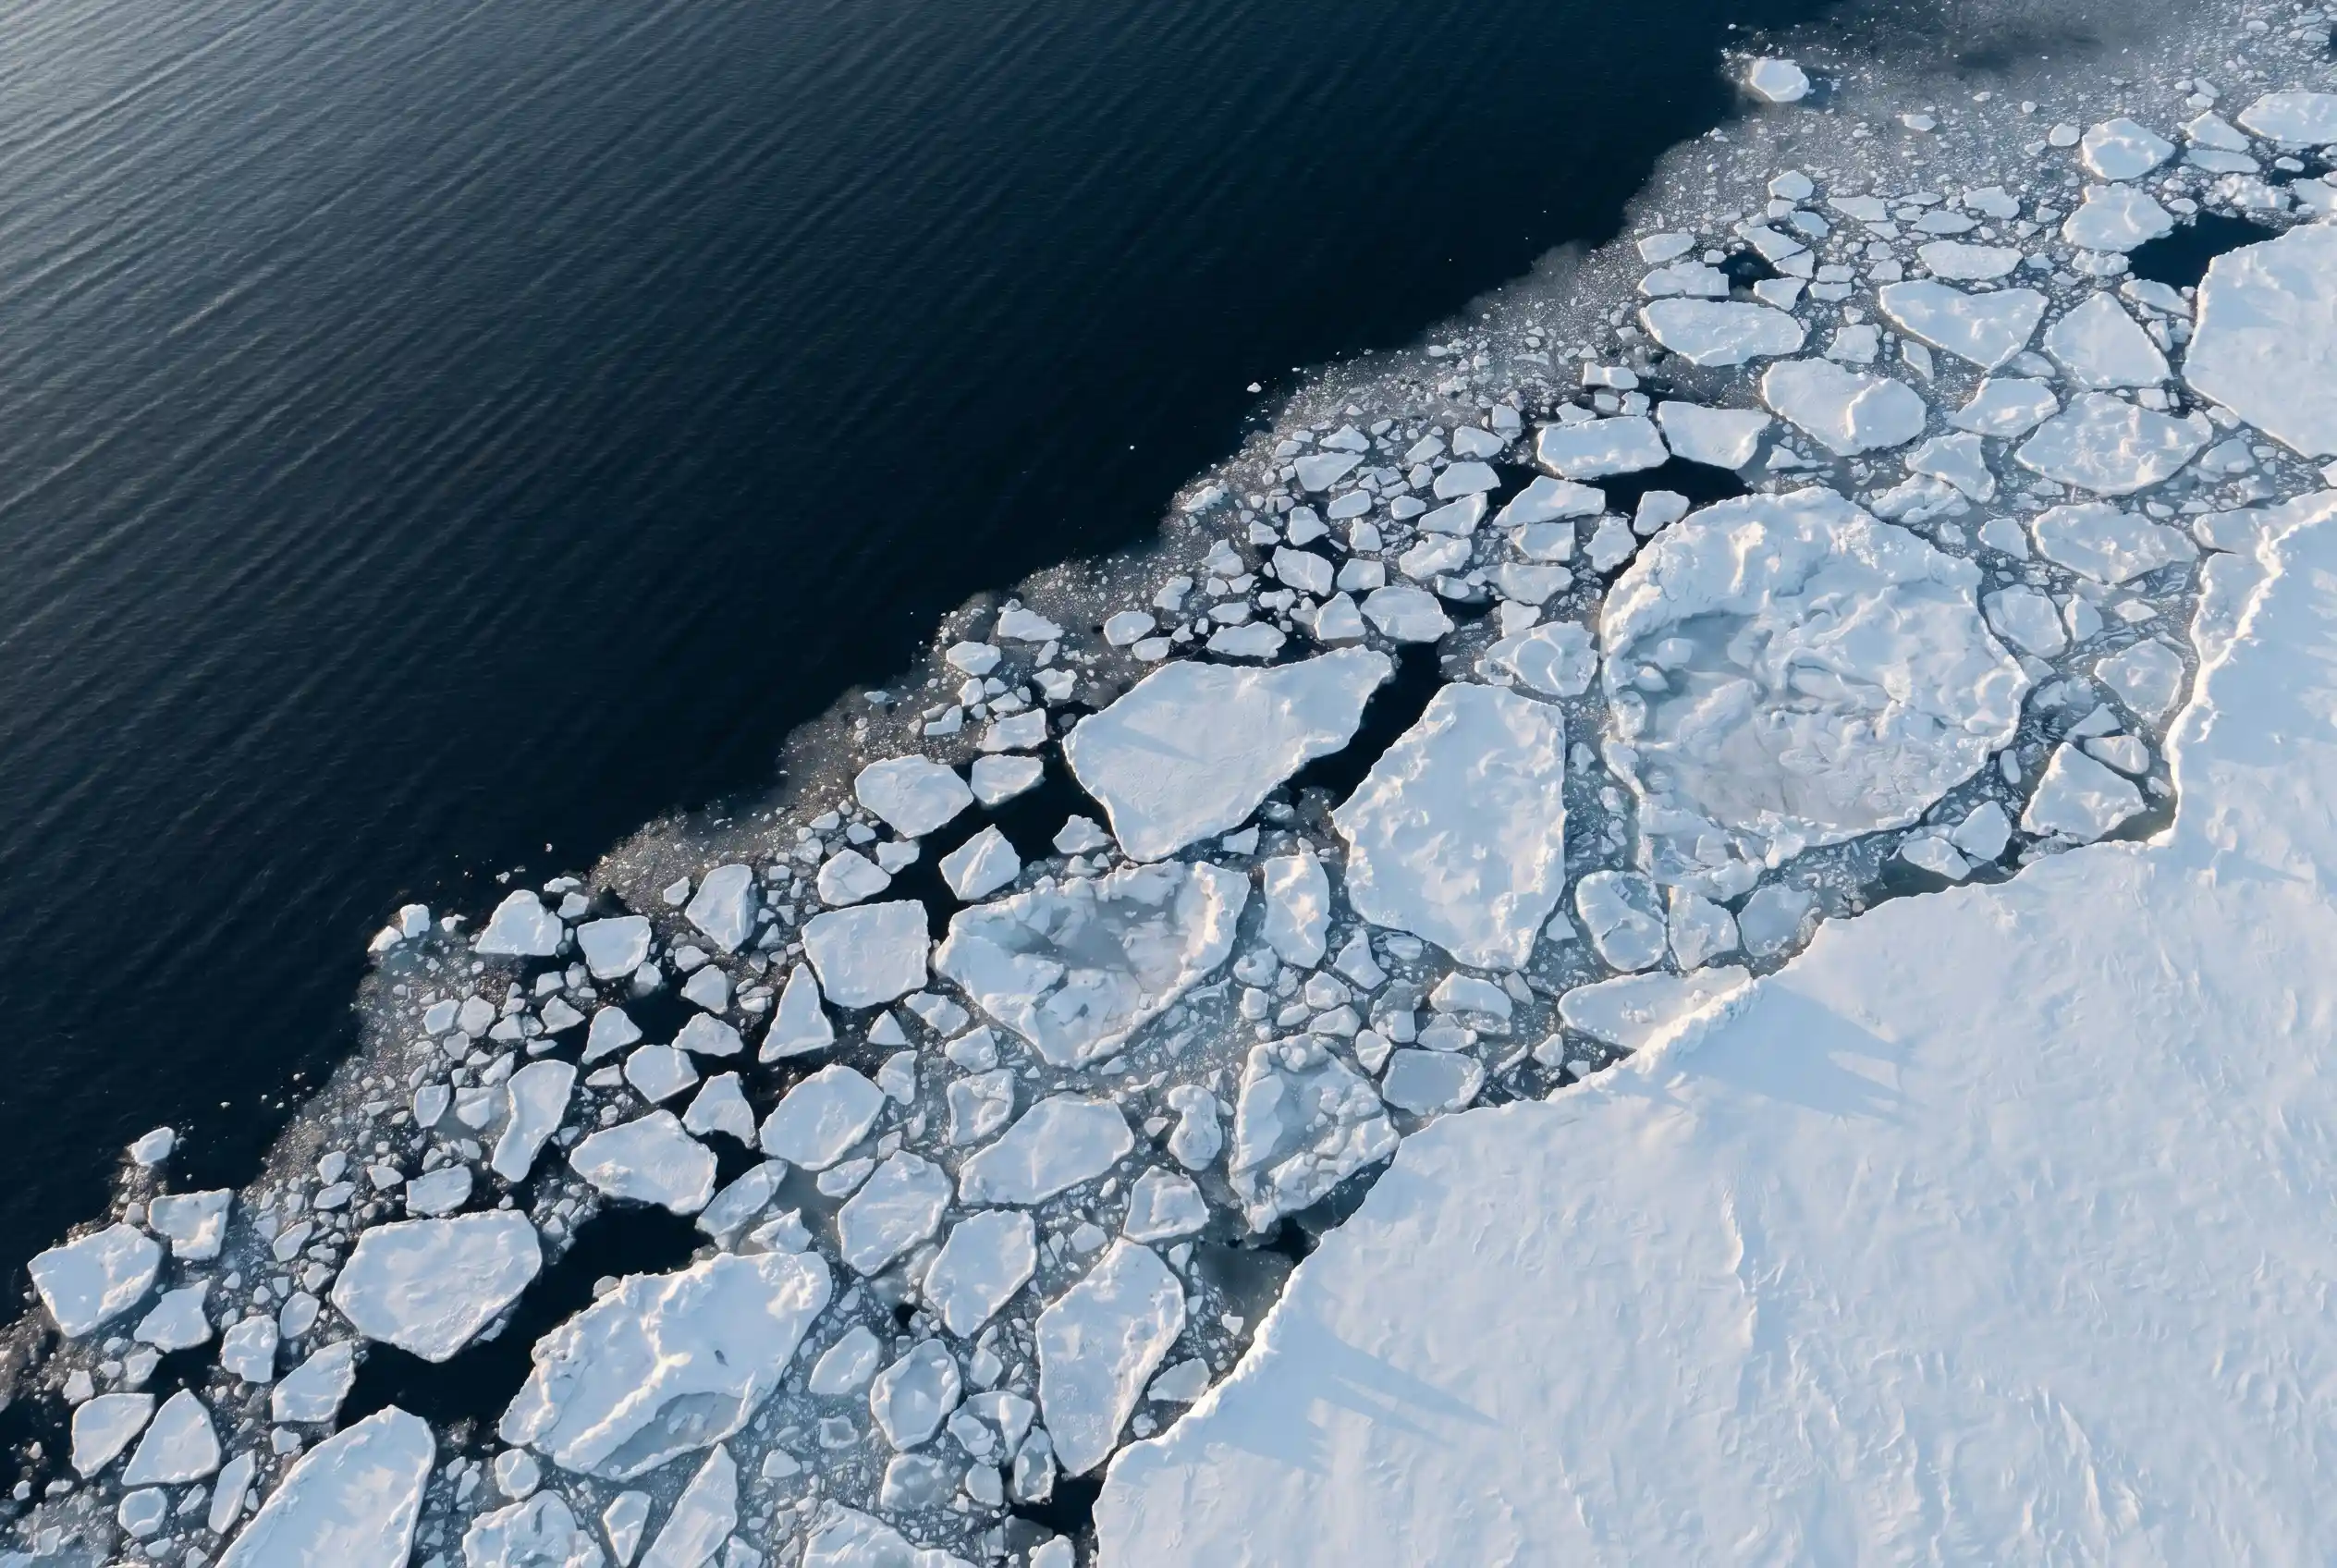
At its outer edge, the sea ice is a moving patchwork rather than a solid sheet. Near open water, swell rolling off the Southern Ocean cracks it into a drifting field of floes; deeper in, the ice knits into a near-solid cap. That broken outer band is the marginal ice zone (MIZ), a ring of ice floes affected by waves from the extremely rough Southern Ocean.
Drawing its edges was always the hard part. Satellites cannot easily watch waves move beneath a field of ice from orbit, so researchers leaned on a stand-in they could measure: how much of the ocean surface the ice covers.
Alex Fraser, lead author of the study and a sea-ice scientist at the Australian Antarctic Program Partnership (AAPP) at the University of Tasmania (UTAS), said the zone has long been drawn using “sea-ice concentration between the arbitrary thresholds of 15% and 80%,” as seen from space.
Those cutoffs were picked for convenience, not physics. A stretch of ocean can be 90% covered by ice and still heave with large waves; it can be half open and lie almost calm. The World Meteorological Organization (WMO, the United Nations body that standardizes weather and ice terms) defines the zone instead as the area of ice cover affected by waves and swell penetrating in from the open ocean. Those legacy methods, built on concentration thresholds, do not relate directly to the physical processes that drive the zone, yet they shaped how the MIZ was charted at both poles for years.
| How the marginal ice zone is defined | Concentration method (legacy) | Wave method (new study) |
|---|---|---|
| What it measures | Share of ocean surface covered by ice | How far waves push into the ice |
| Boundary rule | Ice concentration of 15% to 80% | Point where the wave signal fades out |
| Widest season | Summer | Winter and early spring |
| Tie to physics | Indirect, by proxy | Direct, matches the WMO definition |
| Share of sea-ice zone | Varies with the threshold | About 16% |
How Scientists Measured the Wave-Affected Zone
The fix came from an old idea. Researchers showed as far back as the mid-1980s that satellite radar altimetry could detect waves passing through sea ice. A radar altimeter bounces a pulse off a surface and times the echo, and the approach had largely sat unused for this job. The physics, though, never stopped working.
Fraser’s team pointed it at SARAL (Satellite with ARgos and ALtiKa), a joint Indian and French mission launched in February 2013. Its main instrument was the Ka-band AltiKa radar altimeter, the first satellite altimeter to work in the Ka-band, a high-frequency radar band. The instrument is more compact and sharper than the older generation, and SARAL circles in a sun-synchronous orbit near 800 kilometres, repeating its ground track every 35 days. From 2013 to 2024, the team read the shape of the echoes coming back off the ice.
The signal lives in that shape. Where waves still jostle the floes, the returning pulse is spread out; where the ice falls quiet and flat, the echo turns sharp and peaky, marking the inner limit of wave penetration. The distance from that inner limit out to the open-water ice edge is the width of the wave-affected zone, logged along every pass and published as a marginal ice zone width dataset.
Radar carries one edge over the laser instruments often used on ice: it can see through cloud cover, which let the team trace the wave-affected zone across seasons rather than rely on surface ice concentration alone. Over the cloudiest, stormiest ocean on the planet, that matters, and it opens the way to stretching the record further back with older radar satellites.
The wave-affected zone, by the numbers
- 16% of Antarctica’s sea-ice zone is reached by waves
- 35 to 180 km average width, by season and longitude
- ~200 km width of the floe ring at its broadest
- 12 years of satellite data, 2013 to 2024
- 0.85 R-squared between observations and a wave-ice model
A Seasonal Cycle Flipped on Its Head
The sharper map came with a twist on timing. Concentration-based definitions often place the widest Antarctic marginal ice zone in summer. The wave data show the opposite, with the zone at its broadest in winter and early spring, when the ice edge reaches far enough north to collide with the roughest water in the Southern Ocean.
That summer peak was not a quirk of one dataset. Applied to satellite products, the concentration proxy yields an Antarctic zone that grows from late summer into spring and peaks in December, near the height of the austral summer and months away from the winter maximum the wave record finds.
To test the satellite read-out, co-author Noah Day, a researcher in the School of Mathematics and Statistics at the University of Melbourne, ran it against a model of how waves travel through ice.
Relatively simple wave-ice physics can accurately capture the seasonal evolution of MIZ width.
That was Day’s summary, and his modeling pointed to one dominant control: the waves arriving from open water. Daily averaged observations across Antarctica matched the model closely, at an R-squared of 0.85, meaning it explained about 85% of the variance in the data. Put plainly, the busy, broken edge of the ice behaves about the way the wave physics says it should.
Why the Wave-Beaten Ring Matters
Whether the ice is broken or whole changes how the ocean breathes. Fraser explained that unbroken sea ice forms a more complete cap over the water, slowing the exchange of heat, moisture and gases such as carbon dioxide with the air above; once waves pry the floes apart, the gaps let those exchanges climb. Around Antarctica, where large waves run year-round, the zone plays a substantial role in the climate system by regulating heat and momentum exchange between ocean and atmosphere.
The band also works as a buffer. By taking the brunt of the swell, it shields the consolidated pack ice, the landfast ice and the floating ice shelves behind it from the open ocean’s full force. It is a highly dynamic region, prone to rapid expansion and contraction, which makes it a focal point for predicting how Antarctic sea ice responds to a changing climate.
And it feeds things. As the ice edge retreats in spring, meltwater spreads a fresh, stable layer across the surface that sets off blooms of phytoplankton, the tiny drifting plants at the base of the food web. Those blooms feed swarms of krill, and krill are a key species in many Southern Ocean food webs, the staple of penguins, seals and whales. Antarctica’s seas have nourished giants across the ages, from today’s whales back to the marine reptiles of the deep past, one of which recently surfaced as a fossilized egg unearthed in Antarctica.
Steering an Icebreaker to the Edge
The new map has a customer waiting. Klaus Meiners, a sea-ice scientist at the Australian Antarctic Division, is helping plan a voyage to the marginal ice zone off East Antarctica aboard Australia’s national icebreaker, the RSV Nuyina, in 2028. Knowing where the wave-affected band sits, and how it slides through the seasons, tells the science team where to aim the ship.
With a decade of fine-scale width data in hand, Meiners said, the team “basically know where to steer the ship.” During the voyage they plan to run real-time satellite analyses with the study’s methods, guiding and adapting the sampling as ocean conditions shift. Measurements of waves and ice taken from the deck will then feed back to calibrate the satellite products and check the study’s results, and Meiners said reading how different swell directions shape the zone will help design the fieldwork.
The Nuyina is built for the job. Described as a research platform, icebreaker and resupply ship in one, it can run voyages of up to 90 days, with as many as 80 of them inside the Antarctic zone.
Reading a Sea-Ice Collapse That Began in 2016
The timing could hardly be sharper. For decades, Antarctic sea ice did something the Arctic did not: it held steady, even crept upward. It expanded from the 1970s through 2015, then dropped abruptly to record lows in 2016 and has not recovered.
Since then, the figures have been stark. On 21 February 2023, the ice fell to a summer minimum of 1.788 million square kilometres, a record low since satellite tracking began in the late 1970s. The four smallest minimums in the 47-year record came in 2022, 2023, 2024 and 2025, by the running tally of Antarctic sea-ice minimums, leaving the 2025 low roughly 860,000 square kilometres under the 1981 to 2010 average. Ted Scambos, a senior researcher at the Cooperative Institute for Research in Environmental Sciences (CIRES), called the 2023 winter “completely off the rails.”
Why it turned remains an open question. One line of work ties the shift to wind-driven upwelling that pulls warmer, deeper water toward the surface. Other research points to subsurface warming in the Southern Ocean and argues the ice may have settled into a possible new low-extent state with different seasonal behavior. At the 2023 winter peak, Antarctica was missing a chunk of ice bigger than Western Europe. The wave-beaten edge is where such a change tends to show up first, which is why a tool that measures it directly, season by season, lands at a useful moment.
Frequently Asked Questions: Antarctic Marginal Ice Zone
What Is the Antarctic Marginal Ice Zone?
It is the outer band of sea ice where ocean waves from open water still reach in and break the ice into floes. Around Antarctica it forms a ring that the study measures at roughly 35 to 180 kilometres wide on average, varying with the season and the longitude.
How Much of Antarctic Sea Ice Is Affected by Waves?
About 16%. That figure, drawn from the 2013 to 2024 satellite record, is the share of Antarctica’s sea-ice zone reached by waves; the rest sits far enough inside the pack that open-ocean swell no longer touches it.
How Did Scientists Measure It?
They read radar echoes from the AltiKa altimeter on the French and Indian SARAL satellite. The underlying method, detecting waves in sea ice with satellite radar altimetry, dates back to the mid-1980s. Where the returning waveform turns sharp and peaky, wave passage becomes undetectable, marking the inner edge of the zone.
Why Measure the Zone by Waves Instead of Ice Cover?
Because ice concentration, the old yardstick, has no direct tie to waves. The World Meteorological Organization defines the zone by the waves and swell that penetrate the ice from open water, and the radar method matches that physical definition instead of a satellite proxy.
When Is the Antarctic Marginal Ice Zone Widest?
In winter and early spring. The wave measurements put the zone at its broadest then, when the ice edge sits far north against the roughest Southern Ocean water. That reverses the older concentration-based picture, which often placed the widest zone in summer.
Does the Marginal Ice Zone Drive Antarctica’s Sea-Ice Decline?
No. The study does not pin down the cause of the decline, but it hands scientists a direct, season-by-season way to track the wave-beaten edge where change tends to appear first. Antarctic sea ice expanded until 2015, then fell to record lows from 2016 onward.






Mortgage Rates Climb to an 11-Month High, and Buyers Retreat Fast

FCC Sets August 6 Vote to Erase the 39% TV Ownership Cap

Netflix Heads Into Earnings With Its 2022 Playbook Already Spent

China’s Economy Grows Just 4.3% as Exports Boom and Households Retreat

United Airlines Beats Earnings Estimates Despite $6 Billion Fuel Hit

California’s Plastic Packaging Law Draws Fire From Every Side

xAI Sues a Grok User for CSAM Deepfakes It Struggled to Stop

US Stocks Edge Within 0.5% of a Record as Oil Climbs on War

BlackRock’s Private Markets Bet Pays Off With a Record $15 Trillion in Assets

Kalshi Traders See 93% Odds Gas Tops $4 as Iran Strikes Return

Halo Studios Reverses PS Plus for Halo: Campaign Evolved on PS5

Black Ops 1 and 2 PS5 Ports: $40 Price Tag Has Fans Uneasy

Matt Brown Dismisses Rousey and Paul’s MVP MMA Ratings Win Over UFC

Star Wars: Galactic Racer Is a Roguelite Racer With a Podracing Skin

Julius Randle Traded to Nets as Wolves Reclaim Cap Space for Dosunmu

Sega’s $49.99 Sonic Classic and Modern Bundles Hit Switch in October

Colombia Edge DR Congo as Muñoz Books World Cup Knockout Place

Douze Dixièmes Closes Five Months After MIO: Memories in Orbit

Warriors Take Yaxel Lendeborg, the Oldest Pick in the 2026 NBA Draft

Meta’s Muse Image Lets Anyone Use Your Instagram Photos in AI
-

 TECHNOLOGY3 years ago
How to Adjust a Bulova Watch Band – An Easy Guide
-

 News3 years ago
Fred Pentland: Athletic Bilbao’s English mentor who changed the essence of Spanish football
-

 FINANCE3 years ago
Tax Planning for Every Season: Guide to Maximizing Your Tax Benefits
-

 Education3 years ago
African Ministers New Education Plan
-

 BUSINESS3 years ago
What is Entrepreneurial Operating System? A Comprehensive Guide to EOS
-

 Education3 years ago
Innovate Your Learning Journey with Technology and Enhance Education
-

 News3 years ago
Russians formally out of World Athletics Championships
-

 BUSINESS3 years ago
Top 9 Most Expensive American Cities to Rent an Apartment