
FINANCE
Microsoft High Lifts Indexes as Small Caps Crack Support
Microsoft climbs to a multi-month high and leads IBD screens while major indexes finish higher for the week.

Microsoft shares closed Friday at $513.53, up 1.68%, after climbing roughly 6.3% for the week to their highest level since last November and flashing a fresh buy signal above a cup-base entry near 513.73. The move helped major indexes finish higher even as small caps broke support and Fed Chair Kevin Warsh’s Jackson Hole comments pushed rate-hike odds higher.
Investor’s Business Daily named the stock its Stock of the Day, citing a relative strength line at a seven-month high, a Composite Rating of 98, and industry group rank of 6 out of 197. The software giant also joined the Big Cap 20 list.
That combination of price strength, ratings power and list inclusion put Microsoft at the front of the week’s tape. Mega-cap software absorbed the rate shock that hit smaller names, and the indexes followed the leaders rather than the laggards.
Indexes Finish Higher While Russell Slips
The S&P 500 rose 0.5% for the week to 7,711.76. The Dow Jones Industrial Average gained 0.5% to 53,559.99. The Nasdaq Composite advanced 0.8% to 26,402.42.
Smaller stocks told a different story. The Russell 2000 dropped 1.5% on the week and Russell 2000 fell 1.4% Friday to 2,972.37, breaking recent support as yields climbed.
| Index | Friday Change | Weekly Change | YTD Change |
|---|---|---|---|
| S&P 500 | -0.2% | +0.5% | +12.7% |
| Dow Jones | flat | +0.5% | +11.4% |
| Nasdaq | -0.5% | +0.8% | +13.6% |
| Russell 2000 | -1.4% | -1.5% | +19.8% |
Microsoft alone contributed more than 75 points to the Dow during Friday’s session at one point. Mega-cap software and selected tech names did the heavy lifting while breadth stayed selective.
Friday’s mix made the split plain. The S&P 500, Dow and Nasdaq all posted weekly gains even as each finished the session flat to lower. The Russell 2000 lost ground on both the day and the week and undercut recent support. Year-to-date the small-cap gauge is still ahead at +19.8%, yet the weekly break showed how quickly that lead can stop mattering when yields jump.
Index level strength therefore masked a narrower advance. When one mega-cap can add more than 75 Dow points in a single session, the headline averages can rise while most stocks do not. That pattern defined the week.
Microsoft’s Six-Day Run and Cup-Base Setup
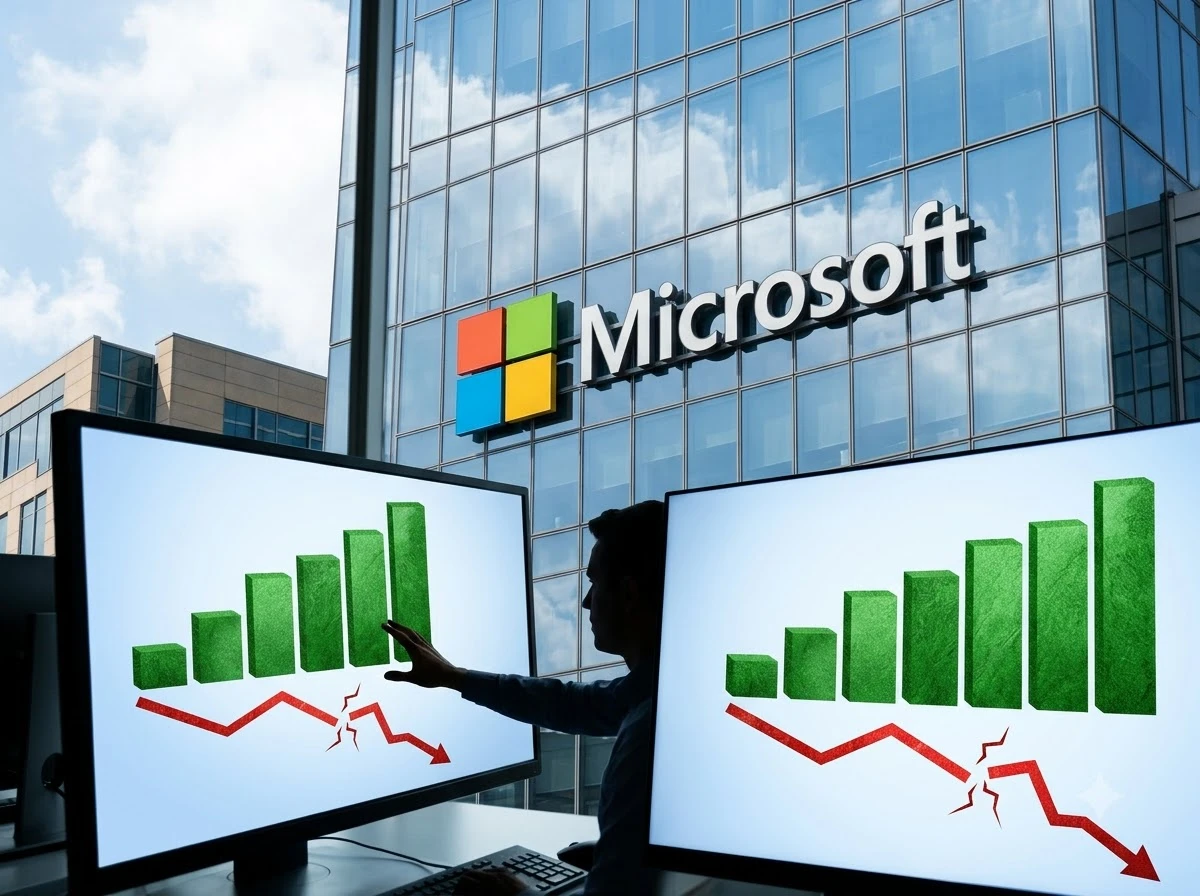
Shares of Microsoft closed Friday at 513.53 after trading as high as 517.78. That marked the sixth straight gain and the longest winning streak since October 2025. The stock is up about 30% over the past month and roughly 7% for the week.
IBD flagged the pattern as a consolidation that can act like a cup base, with the 513.73 level serving as a potential entry. The 52-week range sits between 349.20 and 553.72. Market cap stands near $3.81 trillion.
- Composite Rating: 98 of 99
- Relative strength: seven-month high
- Industry rank: 6 of 197
- Recent pattern: consolidation near cup-base pivot
Volume ran near 29 million shares, below the 50-day average near 39 million, so the advance lacked the explosive turnover typical of classic breakouts.
The technical picture is still constructive on the ratings and the pattern, but the volume gap matters. A close above the 513.73 cup-base entry arrived without a surge through the 50-day average turnover. Traders who treat breakouts as confirmation signals now weigh price acceptance against that lighter participation.
Distance from the range extremes also frames the risk. From the 52-week low at 349.20 the stock has already traveled a long way. The 553.72 high remains the ceiling of the past year. The 513 to 518 zone now functions as the near-term battleground between those poles.
| Reference | Level or Figure |
|---|---|
| Friday close | $513.53 |
| Friday high | $517.78 |
| Cup-base entry | 513.73 |
| 52-week low | 349.20 |
| 52-week high | 553.72 |
| Market cap | near $3.81 trillion |
| Friday volume | near 29 million |
| 50-day average volume | near 39 million |
Software Peers Join the Surge
Elastic jumped 19.3% Friday to a 52-week high after reporting adjusted EPS of $0.70 versus $0.58 expected and revenue of $478 million, up 15%. Fiscal 2027 guidance also topped forecasts. Other software names appeared on IBD’s best-stocks screens alongside Microsoft.
The sector had faced questions about whether traditional software would lose ground to pure AI platforms. Recent results and partnerships pushed those fears back. D.A. Davidson analyst Gil Luria pointed to Anthropic’s expanded Salesforce deal as a positive halo for Microsoft’s orchestration role. StoneX analyst Yi Fu Lee cited growing confidence that Copilot and GitHub can monetize AI beyond the core cloud.
Elastic’s beat supplied a fresh fundamental spark for the group. An EPS print well above the $0.58 expectation, double-digit revenue growth and stronger fiscal 2027 guidance gave buyers a reason to chase a peer to a 52-week high on the same day Microsoft held its breakout zone. Screens that already featured Microsoft picked up other software names in the same sweep.
The analyst notes map the narrative shift. Luria’s read on the Anthropic and Salesforce pairing treats Microsoft as a beneficiary of wider AI deal flow, not only of its own product cycle. Lee’s focus on Copilot and GitHub points to monetization paths that sit outside raw Azure consumption. Together they describe a sector rebuilding confidence that established software platforms can capture AI spending rather than cede it.
July Earnings Still Fuel the Advance
The latest leg higher traces to Microsoft’s fiscal fourth-quarter results reported July 29. Revenue hit $90.0 billion, up 18%. Operating income rose 18% to $40.6 billion. Diluted EPS reached $4.81, or $4.74 excluding OpenAI investment effects.
We are advancing the frontier on the cost-to-outcome curve, ensuring every customer can turn tokens into business results. This year, Azure revenue surpassed $100 billion for the first time, and Microsoft 365 Copilot reached over 30 million paid seats.
Satya Nadella, chairman and chief executive officer, Microsoft earnings release
Microsoft Cloud revenue came in at $59.3 billion, up 27%. Azure and other cloud services grew 43%. Commercial remaining performance obligations climbed 84% to $678 billion. Full-year revenue reached $331.8 billion, up 18%. The company returned $10.2 billion to shareholders in the quarter via dividends and buybacks.
CFO Amy Hood highlighted the cloud strength. The numbers showed AI demand translating into durable cloud growth even as Windows OEM and Xbox faced pressure.
The July 29 report remains the fundamental anchor for the six-day climb and the roughly 30% gain over the past month. Growth held at 18% for both revenue and operating income, while cloud and Azure ran well ahead of the consolidated pace. That gap explains why investors keep treating the stock as an AI compounder rather than a mature software name treading water.
| Measure | Result | Change |
|---|---|---|
| Total revenue | $90.0 billion | +18% |
| Operating income | $40.6 billion | +18% |
| Diluted EPS | $4.81 ($4.74 ex-OpenAI) | – |
| Microsoft Cloud revenue | $59.3 billion | +27% |
| Azure and other cloud | – | +43% |
| Commercial RPO | $678 billion | +84% |
| Full-year revenue | $331.8 billion | +18% |
| Capital returned | $10.2 billion | dividends and buybacks |
Nadella’s emphasis on the cost-to-outcome curve and on turning tokens into business results ties the AI story to customer economics, not only to capacity buildout. Azure’s first trip past $100 billion in annual revenue and Copilot’s move above 30 million paid seats give that claim hard markers. The 84% jump in commercial remaining performance obligations to $678 billion extends the same theme into future periods.
Pressure in Windows OEM and Xbox did not reverse the tape. Hood’s focus on cloud strength matched what the market chose to reward. Shareholders also saw $10.2 billion returned through dividends and buybacks, a cash-back layer alongside the growth story.
Warsh Speech and Rising Yields Test Breadth
Friday’s session turned choppy after Fed Chair Kevin Warsh spoke at Jackson Hole. Markets read the remarks as more hawkish on inflation, lifting short-end Treasury yields. The 2-year note yield rose 12 basis points on the week to 4.35%. The 10-year settled near 4.72%.
Chip stocks retreated and smaller names sold off harder than the mega-caps. Chicago PMI came in at 47.1 against a 57.0 consensus. Final University of Michigan consumer sentiment hit 51.7. Persistent inflation worries kept consumers cautious.
Leadership stayed narrow. Software and a handful of large tech names offset weakness elsewhere. The S&P 500 Bullish Percent indicator had already reversed lower earlier in the week, signaling softer participation even while indexes held gains.
The yield move set the tone for rotation. A 12-basis-point rise in the 2-year to 4.35% and a 10-year near 4.72% raised the discount rate on longer-duration growth stories and on weaker balance sheets. Mega-cap software held up. Chips and the Russell 2000 did not.
- 2-year Treasury yield: 4.35%, up 12 basis points on the week
- 10-year Treasury yield: near 4.72%
- Chicago PMI: 47.1 versus 57.0 consensus
- University of Michigan sentiment: 51.7 final reading
- S&P 500 Bullish Percent: reversed lower earlier in the week
Soft survey data added to the caution. Chicago PMI at 47.1 missed a 57.0 consensus by a wide margin and kept the contraction signal intact. Consumer sentiment at 51.7 showed households still guarded. In that backdrop, capital crowded into the names with the clearest earnings momentum and the deepest liquidity.
The earlier reversal in the S&P 500 Bullish Percent indicator already warned that participation was fading. Friday’s Russell break and the chip pullback fit that signal. Index gains built on a handful of software and large tech names can persist for a stretch, yet they leave the tape exposed if those leaders stall.
How Cloud Metrics Underwrite the Breakout
The cup-base entry near 513.73 and the IBD ratings give technicians a clean framework. The July 29 fundamentals give that framework its fuel. Linking the two shows why the stock could grind higher for six sessions even as volume stayed below average and breadth thinned.
- July 29: Fiscal fourth-quarter results land with revenue of $90.0 billion, up 18%, and Azure and other cloud services up 43%.
- Since the report: Shares advance about 30% over the past month as Azure’s $100 billion annual mark and Copilot’s 30 million paid seats reset the growth debate.
- This week: The stock posts its longest winning streak since October 2025, clears the cup-base zone near 513.73, and closes Friday at 513.53 after a high of 517.78.
- Friday: Warsh’s Jackson Hole remarks lift yields, the Russell 2000 breaks support, and Microsoft still adds more than 75 Dow points at one stage.
Commercial remaining performance obligations at $678 billion, up 84%, are the bridge from past results to future revenue. That backlog is contracted business. It supports the claim that AI demand is landing in multi-year cloud commitments rather than one-off experiments.
Microsoft Cloud revenue of $59.3 billion, up 27%, already runs ahead of the 18% company-wide pace. Azure’s 43% growth rate widens the gap further. Full-year revenue of $331.8 billion, also up 18%, shows the same trend at annual scale. The market is paying for that differential.
Copilot’s more than 30 million paid seats and the analyst focus on GitHub monetization add a software layer on top of infrastructure growth. The orchestration role Luria described and the beyond-the-core-cloud path Lee described both depend on that installed base. The breakout above 513.73 is the technical expression of those operating trends.
Narrow Tape Puts the Burden on Leaders
Weekly gains in the S&P 500, Dow and Nasdaq arrived beside a 1.5% decline in the Russell 2000 and a Friday support break at 2,972.37. That split is the week’s second story, equal in weight to Microsoft’s own run.
When leadership is this concentrated, index direction hinges on a short list of names. Microsoft’s session contribution of more than 75 Dow points illustrates the mechanism. A handful of mega-cap software and tech stocks can offset losses across chips, small caps and weaker cyclicals. They cannot manufacture broad demand if the Bullish Percent indicator is already rolling over.
Rate fears accelerate that divide. Higher short-end yields after the Warsh comments hit duration-sensitive and balance-sheet-sensitive names first. The Russell’s break and the chip retreat were the visible result. Software leaders with fresh earnings, large backlogs and IBD-level relative strength absorbed the same shock.
YTD figures still favor the Russell at +19.8% against +12.7% for the S&P 500, +11.4% for the Dow and +13.6% for the Nasdaq. The weekly tape ignored that longer lead. Near-term flows followed strength and liquidity, not catch-up potential in smaller names.
For as long as Azure growth, Copilot seats and the $678 billion commercial backlog keep Microsoft in the top tier of ratings and screens, the stock can remain a primary carrier of index-level gains. The risk is mechanical. If the 513 to 518 zone fails or if software peers stop confirming, the same narrow structure that lifted the averages can work in reverse.
What the Mask Leaves Exposed
Microsoft’s position as an AI winner remains intact on the numbers: Azure past the $100 billion annual mark, Copilot seats above 30 million, and a commercial backlog that locks in multi-year revenue. The cup-base setup and IBD ratings give growth investors a clear technical framework.
Yet the same week that produced the high also produced a Russell 2000 support break and a fresh reminder that rate fears can hit breadth first. Titans can carry indexes for a stretch. They cannot invent participation that is not there.
Traders watching the 513-518 zone now also watch whether small-cap weakness spreads or whether the software rebound broadens. The next few sessions will show whether the Microsoft-led lift was the start of wider strength or simply the latest example of mega-cap cover.
Disclaimer: This article is news reporting and market analysis based on publicly available data as of August 29, 2026. It is for informational purposes only and does not constitute investment advice, a recommendation, or an offer to buy or sell any securities. Stock prices, ratings and technical patterns can change rapidly. Readers should consult a qualified financial advisor or investment professional before making any investment decisions. Figures reflect the cited sources at the time of writing and may no longer be current.


Walmart’s $50 Million Opioid Settlement Closes Case Without Admission

California Sues Over $120 Million Morro Bay Wind Lease Buyout

Gilead Bixlenvo FDA Nod Opens Single Pill Path for Complex HIV Cases

Meta’s $18B Kids Deal Forever Shields Data Used to Spot Under-13s

Lettuce Outbreak Drove Record Cyclospora Spike Across 20 States

Amazon Shaves $20 Off M6 Mac Mini Before It Even Ships

SpaceX Louisiana Port Tests Debt Markets on Orbital AI Scale

Microsoft High Lifts Indexes as Small Caps Crack Support

Apple Replays 2015 Saturday Midnight Preorder for iPhone 18 Pro

Updated COVID Shots Clear FDA but Access Friction Hits High-Risk Groups

Take-Two CEO Pushes Netflix Subs for GTA 6 Extended Look

Halo Campaign Evolved Skulls Meet Death Barriers That Kill the Hunt

Wildlands Free Update Hands Players the Tools They Already Invented

Destiny 2 Fans Unlock Vaulted Maps After Live Service Ends

Quake Gets 19 Free Maps From MachineGames Quake Club

Quordle Monday Delivers Gavel Crush Speed Ethos Cleanly

Stripe Bid Shows PayPal Moat Cracked After Years of Slide

Tyson’s Five-Year Utah Plant Falls to Cattle Shortage Reckoning

Silver Lake Workday Talks Signal Private Floor for Software

Kennedy Lewis Takes Majority Control of The Greenbrier in $500M Deal
-

 TECHNOLOGY3 years ago
How to Adjust a Bulova Watch Band – An Easy Guide
-

 News3 years ago
Fred Pentland: Athletic Bilbao’s English mentor who changed the essence of Spanish football
-

 FINANCE3 years ago
Tax Planning for Every Season: Guide to Maximizing Your Tax Benefits
-

 Education3 years ago
African Ministers New Education Plan
-
 BUSINESS3 years ago
What is Entrepreneurial Operating System? A Comprehensive Guide to EOS
-

 Education3 years ago
Innovate Your Learning Journey with Technology and Enhance Education
-

 News3 years ago
Russians formally out of World Athletics Championships
-

 BUSINESS3 years ago
Top 9 Most Expensive American Cities to Rent an Apartment