
NEWS
Warmer Oceans Drove Most Polar Ice Loss Since 1979
IMBIE’s 50-year satellite ledger shows 84% of Greenland and Antarctic ice loss came from faster glaciers, not surface melt, with more rise already in the pipeline.

11,309 billion tonnes of ice left Greenland and Antarctica from 1979 to 2023, and 84% of that loss came from glaciers speeding into the sea. The Ice Sheet Mass Balance Inter-comparison Exercise, published on 16 September 2026 in Scientific Data, combined 42 independent satellite estimates drawn from 27 missions. Only 16% of the ice left as melt on the surface; the rest was discharged by glaciers that had sped up, a delayed answer to ocean heat that the authors say will keep running for decades even if planetary heating stopped.
That 11,309 billion tonnes is 11.3 trillion tonnes, or about 12.5 trillion US tons, enough frozen water to stack ice 5 feet deep across the continental United States. It raised global sea level by 31.4 millimetres, with an uncertainty of 1.6 millimetres, and the ice sheets now account for almost a quarter of the worldwide rise.
Four-Fifths of the Lost Ice Went Into the Sea
Inès Otosaka, an ice scientist at Northumbria University who led the assessment, said the extra years of satellite coverage change what the ledger is actually counting. Surface melt is the image most people hold: summer slush, darker snow, water pouring off the top. The new record says that picture is the smaller term.
By reaching back to the 1970s, we can now see how the ice sheets have changed across half a century. More than four-fifths of the ice lost was discharged into the ocean by faster-flowing glaciers, rather than melted at the surface, which tells us the long-term trend is being driven by the dynamic response of the ice sheets to a warming ocean.
Inès Otosaka, ice scientist, Northumbria University, IMBIE 2026 release
The paper’s own split is glacier dynamical imbalance driving 84 percent of the combined loss, with reduced surface mass balance the remaining 16%. In plain terms, the ice is not mainly puddling on top. Warm water is chewing at glacier fronts and ice-shelf undersides, loosening the brakes that hold the interior back, so the ice streams run faster and dump more ice over the grounding line.
Greenland still has a real air-melt term. Of the 6,215 billion tonnes it lost from 1972 to 2023, 67% came from increased ice discharge and 33% from a weaker surface budget, at an average 119 billion tonnes a year. Antarctica’s net loss of 4,780 billion tonnes, by the team’s account, was caused by ocean melting of its outlet glaciers. The combined 84% figure is that Antarctic ocean signal pulling the average up.
ESA’s CryoSat mission, which holds an unbroken 16-year altimetry record inside the new ledger, put the same finding on the record the day the paper landed.
🫠 Half a century of satellite data shows 11 trillion tonnes of ice loss 🫠
The longest satellite data record of ice-sheet change ever assembled reveals that Greenland and Antarctica have lost a staggering 11 trillion tonnes of ice since the 1970s, driving global sea level up by… pic.twitter.com/HL40xYyVZu
— ESA's CryoSat mission (@esa_cryosat) September 16, 2026
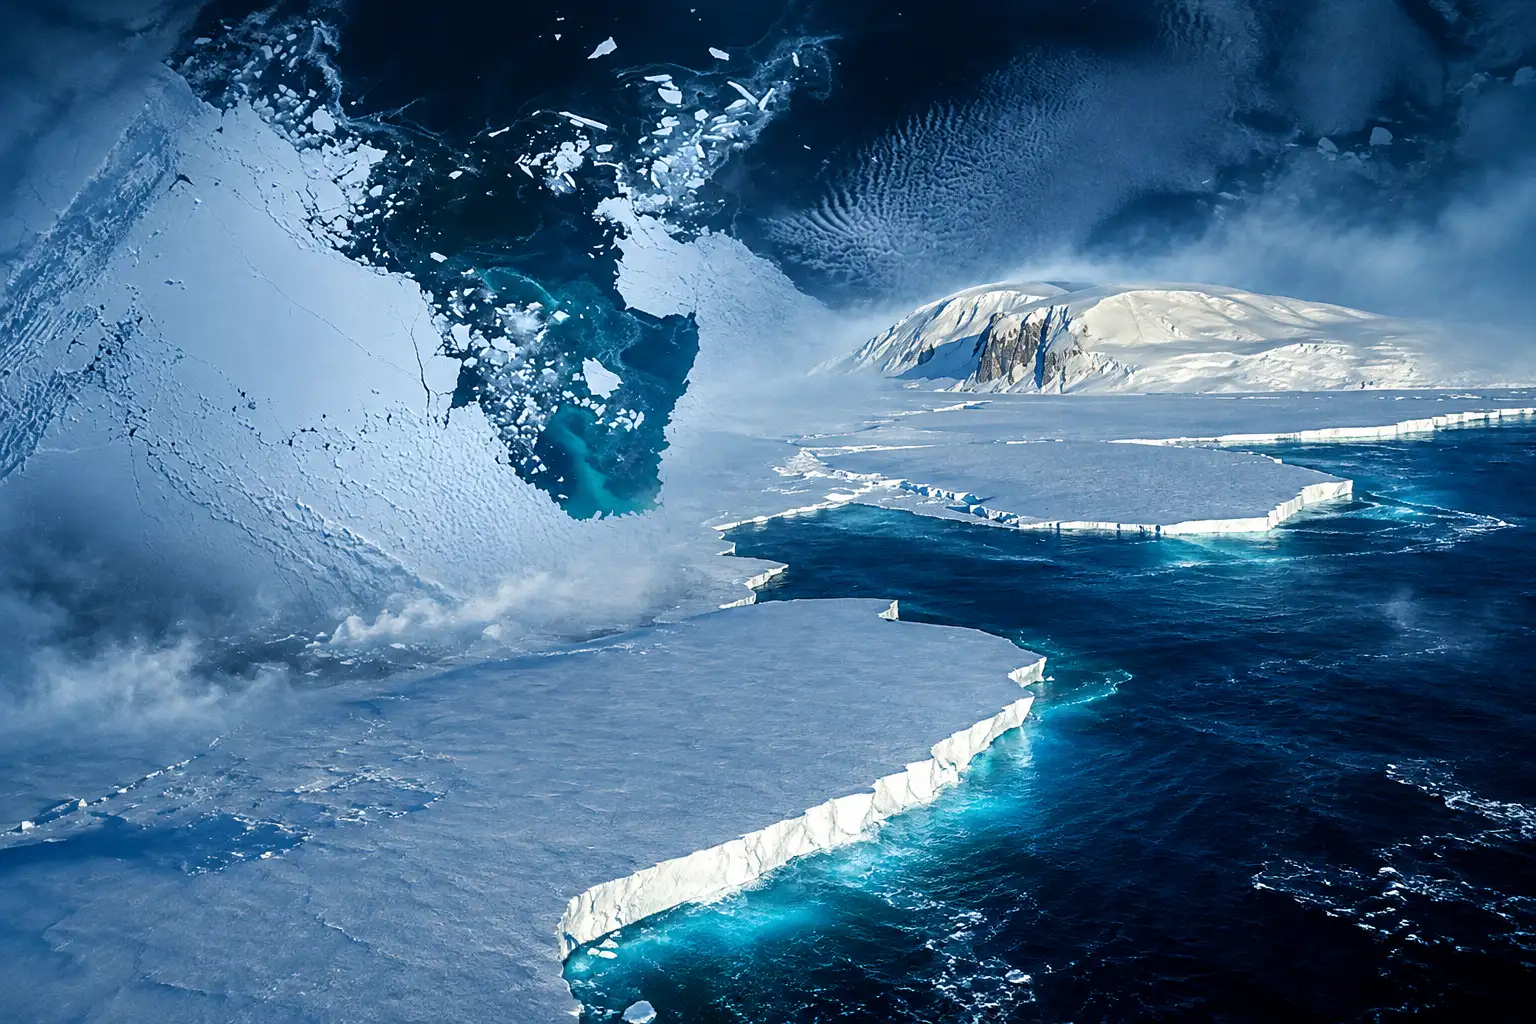
West Antarctica Has Sped Up in Every Decade
Greenland sat close to balance in the 1970s, then the annual loss climbed from around 60 billion tonnes a year in the 1980s to 264 billion in the 2010s, a 4.4-fold rise in a decade marked by repeated extreme summer melt. Antarctica’s rate rose from around 48 billion tonnes a year in the 1980s to 202 billion in the 2010s, a 4.2-fold increase. Together those decade rates went from about 108 billion tonnes a year to 466 billion, a 4.3-fold jump.
The steepest climb sits in West Antarctica, where ice discharge led by Pine Island and Thwaites has risen in every decade of the record.
ICE LOSS BY DECADE
| Region | 1980s (billion tonnes/year) | 2010s (billion tonnes/year) | Increase |
|---|---|---|---|
| Greenland | about 60 | 264 | 4.4 times |
| Antarctica | about 48 | 202 | 4.2 times |
| West Antarctica | 29 ± 7 | 163 ± 12 | 5.6 times |
Otosaka said Jakobshavn Glacier in Greenland is now retreating up to 164 feet a day. That is a single outlet, not the whole sheet, but it is the kind of motion the 84% term is built from: ice leaving as a solid, not as a puddle.
Eric Rignot, an ice scientist at the University of California, Irvine and a co-author, said the ice sheets are melting away fast, and that sea level is rising worldwide and will worsen the vulnerability of coastal regions.
A Snowy Pause Hid the Same Glaciers
From 2020 to 2023 the accelerating totals seemed to stall. The paper treats that dip as weather laid over the same long rise, not a change of direction. East Antarctica’s 45-year mass trend is 1 ± 9 billion tonnes a year, indistinguishable from balance. Record snowfall in 2022 and 2023 then produced a gain of 92 ± 63 billion tonnes a year across the last four years of the record, enough to offset losses farther west. Antarctica’s rate of mass loss in 2020 to 2023 was more than three times smaller than in the 2010s. On Greenland, a run of milder summers roughly halved surface melting.
WHY THE 2020 TO 2023 DIP WAS A BLIP
- East Antarctic snow: Record precipitation in 2022 and 2023 added mass on the most stable part of the continent and masked continued loss in the west.
- Milder Greenland summers: Less surface melt cut the air-driven third of Greenland’s budget, which is the term that jumps around from year to year.
- West Antarctic discharge: Pine Island and Thwaites kept speeding up; the ocean-driven term did not reverse.
Rignot called the three-year hiatus a bump in the record, with the long rise set by climate. Otosaka said the published series stops with 2023, but she has looked at measurements since and found the accelerating trend has picked back up. The lost ice is still a small slice of what remains on land, which is why a few centimetres of sea level can sound modest even while the ocean-driven rate climbs. The paper’s warning sits in that rate, and in the way glacier flow can jump rather than drip.
How Much Sea Level Did 11,309 Billion Tonnes Add?
The study uses a simple conversion: 360 billion tonnes of ice is roughly 1 millimetre of global sea-level rise. On that scale the 11,309 billion tonnes added 31.4 millimetres. Greenland accounted for 18.1 millimetres of that total and Antarctica 13.3 millimetres.
WHAT 11,309 BILLION TONNES DID TO THE SEA
- 31.4 millimetres: Combined sea-level rise from both ice sheets from 1979 to 2023, with an uncertainty of 1.6 millimetres.
- 6 to 9 million people: Andrew Shepherd, IMBIE founder at Northumbria, said just over three centimetres, a rounding of that 31.4 millimetre rise, puts another 6 to 9 million people at risk of coastal flooding and erosion.
- 2 to 3 million per centimetre: Otosaka said that for every centimetre of sea-level rise, another 2 to 3 million people get flooded at least once a year.
Those people are the ones who inherit the lag. Ice that has already sped up does not wait for next year’s air temperature. David Holland, an ice scientist at New York University who was not on the paper, said most of the ice loss is dynamical, which is what you would expect in an ice-sheet instability collapse scenario. Ted Scambos, an ice scientist at the University of Colorado who also sat outside the study, called Antarctic mass-loss wild cards a clear danger, but one that still sits many decades ahead.
The Record Now Reaches Back to Landsat
Earlier IMBIE ledgers started in 1992, when radar altimetry, the GRACE gravity missions, and continent-wide velocity maps finally overlapped. This version pulls in the early Landsat archive so Greenland can be tracked from 1972 and Antarctica from 1979, in years when coverage was patchy enough that discharge had to be interpolated and the error bars widened. The longest satellite record ever assembled is the product of that salvage job, backed by ESA and NASA, with CryoSat-2, the Sentinels, ICESat-2 and the GRACE pair among the 27 missions.
Mass is counted three ways. Altimeters watch the ice get thinner. Gravity satellites watch the Earth get slightly lighter over Greenland and Antarctica. The input-output method subtracts snowfall and surface melt from the ice that streams through gates near the grounding line. Regional climate models then split the total into a surface term and a flow term. Tyler Sutterley of the University of Washington Applied Physics Laboratory, a co-lead, said the added length of the record, the larger pool of teams, and a tighter handle on uncertainty make this the most robust assessment of ice-sheet mass balance produced so far.
The new Antarctic rate also runs hotter than the last consensus. Over the overlapping years 1992 to 2020, this dataset finds Antarctic loss at 140 ± 13 billion tonnes a year against 92 ± 18 in the previous IMBIE assessment, which reported 21.0 millimetres between 1992 and 2020 from both ice sheets. Greenland stayed consistent (180 ± 12 against 169 ± 16). Part of the Antarctic lift is altimetry over the Peninsula, now 20 ± 3 billion tonnes a year for 1992 to 2018 against 6 ± 1 before, which brings that method into line with gravity and input-output. The reconciled ice-sheet mass-balance files are posted as annual rates and cumulative anomalies for each sheet, split into surface, dynamics, and total change.
The Ice Sheets Are Still Catching Up to the Heat
Shepherd said the changes are tracking decades behind global warming, which means they can be expected to continue for decades more, even if heating of the planet stopped. That is the delayed bill inside the 84%. Ocean heat already parked against the ice fronts keeps working after a summer cools. Ice shelves that have thinned keep offering less resistance. A glacier that has sped up does not drop back to its 1980s pace because the air had a quiet year.
HOW THE ICE-SHEET LEDGER GREW
- 2012: First IMBIE assessment covers 1992 to 2011 and finds the ice sheets adding 11.1 millimetres to sea level.
- 2018: Antarctic update for 1992 to 2017 reports 2,720 billion tonnes lost, or 7.6 millimetres of sea-level rise, with more than half of that loss after 2012.
- 2020: Greenland update for 1992 to 2018 reports 3,902 billion tonnes lost, or 10.8 millimetres.
- 2023: Combined 1992 to 2020 assessment reports 21.0 ± 1.9 millimetres from both sheets, with the loss rate rising from 105 billion tonnes a year in 1992 to 1996 to 372 billion in 2016 to 2020.
- 16 September 2026: The Landsat-era ledger publishes 11,309 ± 565 billion tonnes from 1979 to 2023 and the 84% ocean-driven split.
The paper notes that high-end estimates of global sea-level rise by 2150 increase by a factor of 2.6 once the risk of ice-sheet instability is included. Diego Fernández, head of the science section at ESA, said the findings show why the satellite series has to be kept going, including CryoSat-2 and the Sentinels, if the models used to forecast that range are going to be tested against what the ice is actually doing.
Three centimetres of sea level rise may sound small, but that puts another six to nine million people at risk of coastal flooding and erosion. With the ice sheets set to lose much more ice in the decades ahead, global assessments like IMBIE are vital to protecting communities impacted by climate change.
Andrew Shepherd, IMBIE founder, Northumbria University
Otosaka’s post-2023 readings already show the speed-up returning after the snowy pause. The ocean is still at the glacier fronts. The 11,309 billion tonnes are the part of the bill that has come due; the rest is still on the ice, moving faster than it did in the 1980s.
Frequently Asked Questions
When Does the Satellite Record Start for Greenland and Antarctica?
The reconciled dataset covers Greenland from 1 July 1971 to 31 December 2023 and Antarctica from 1 January 1979 to 31 December 2023. In years with no or poor velocity measurements, including the gap between Landsat-1/2 and Landsat-4/5, ice discharge was linearly interpolated and its uncertainty was increased in proportion to the time since the nearest good survey.
Did East Antarctica Lose Ice Over the Full Record?
East Antarctica’s average 45-year mass trend is 1 ± 9 billion tonnes a year, inside the uncertainty of a balanced sheet. The recent gain of 92 ± 63 billion tonnes a year across the last four years of the series came from record snowfall in 2022 and 2023, not from a slowdown in West Antarctic discharge.
Why Is the New Antarctic Loss Rate Higher Than the Last IMBIE Assessment?
Over the 1992 to 2020 overlap, the new dataset finds Antarctic loss at 140 ± 13 billion tonnes a year against 92 ± 18 in the 2023 assessment. One documented fix is Peninsula altimetry, which now reads 20 ± 3 billion tonnes a year for 1992 to 2018 against 6 ± 1 before, bringing that method into agreement with gravity and input-output estimates.
How Many Satellite Estimates Went Into the 2026 IMBIE Dataset?
The team combined 23 estimates for Greenland, made up of 6 altimetry series, 14 gravimetry series and 3 input-output series, and 19 estimates for Antarctica, made up of 5 altimetry series, 13 gravimetry series and 1 input-output series, for 42 estimates in all from 27 missions.

Final Fantasy Resonance Turns a Dead Gacha Into HD-2D

PHP2Shell Forced Sites Offline While Exploits Stalled

Kindle+ Folds AI Audiobooks Into the Page-Read Fund

Chip Stocks Fall as the Bond Rally Cheapens AI Spend

Comcast’s Record Odyssey Quarter Doubles as the Exit

Microsoft 365 Auth Fault Took Down Exchange and Teams

Xbox Caps Game Pass Cloud Gaming at 15 Hours

OpenClaw 2.0 Ships a Team Workplace With Host-Trust Defaults

OpenAI Unveils GPT-6 Astra With a Critical Cyber Label

Diesel Breaks Its Record as the White House Claims Credit
-
 NEWS2 months ago
Microsoft 365 Auth Fault Took Down Exchange and Teams
-
 GAMING2 months ago
Xbox Caps Game Pass Cloud Gaming at 15 Hours
-
 NEWS2 months ago
OpenAI Unveils GPT-6 Astra With a Critical Cyber Label
-
 NEWS2 months ago
OpenClaw 2.0 Ships a Team Workplace With Host-Trust Defaults
-
 BUSINESS2 months ago
Diesel Breaks Its Record as the White House Claims Credit
-

 LIFESTYLE2 months ago
Squishy Dumpling Toys Recalled After Hiding Illegal Water Beads
-

 BUSINESS2 months ago
ChargePoint Stock Rally Prices Wilmer’s Three-Year Cash Plan
-

 AUTO2 months ago
Tesla Puts Its Wheel-Free Cybercab on Austin Streets