
BUSINESS
Indian Factories Took the Hit From 12.29 Percent WPI
India’s wholesale inflation hit 12.29 percent in October as factories absorbed fuel, metal and chemical costs their output prices did not cover.

India’s wholesale inflation rose to 12.29 percent in October, a print the Ministry of Commerce and Industry tied to fuel and power, metals, chemicals and a handful of other lines. The ministry’s provisional wholesale price index for October put all commodities at 113.3, up from 112.5 in September, a 0.71 percent monthly rise.
Manufactured products hold 63.13 percent of that basket, and their index stayed at 110.2 for a second month. Fuel and power did about nine-tenths of the climb. The bill landed on plants that buy crude, mineral oils, power, metals and chemicals, not on a fresh round of factory selling prices.
➤ All India Wholesale Price Index (#WPI) inflation for October 2026 is 12.29 per cent on year-on-year (YoY) basis, compared to 11.39 per cent in September 2026.
➤ The index for All Commodities for October 2026 stands at 113.3, whereas it was 112.5 in September 2026.
➤ YoY… pic.twitter.com/2qdc8eTeBG
— PIB India (@PIB_India) November 16, 2026
A Flat 110.2 on the Factory Shelf
Year on year, manufactured products inflation eased to 9.54 percent from 9.76 percent in September. That is still a high annual rate. It is also a freeze on the month: the index did not move from 110.2, so factories as a group did not mark up output in October even as several input lines did.
Primary articles, 22.76 percent of the basket, rose only to 120.6 from 120.3, with inflation at 9.24 percent after 8.67 percent. The all-commodities index still jumped because the fuel and power group, 14.11 percent of the basket, went from 110.5 to 115.7. That 4.71 percent monthly increase in one group accounts for about nine-tenths of the 0.8 point rise in the headline index.
The ministry named the October drivers as mineral oils, crude petroleum and natural gas, electricity, food articles, basic metals, chemicals, food products, non-food articles, textiles, and rubber and plastic products. Inside manufacturing, the mix was uneven. Basic metals rose to 106.9 from 106.2 and chemicals to 106.6 from 106.0, while textiles slipped to 104.8 from 105.2. The flat 110.2 is an average, not a calm shop floor.
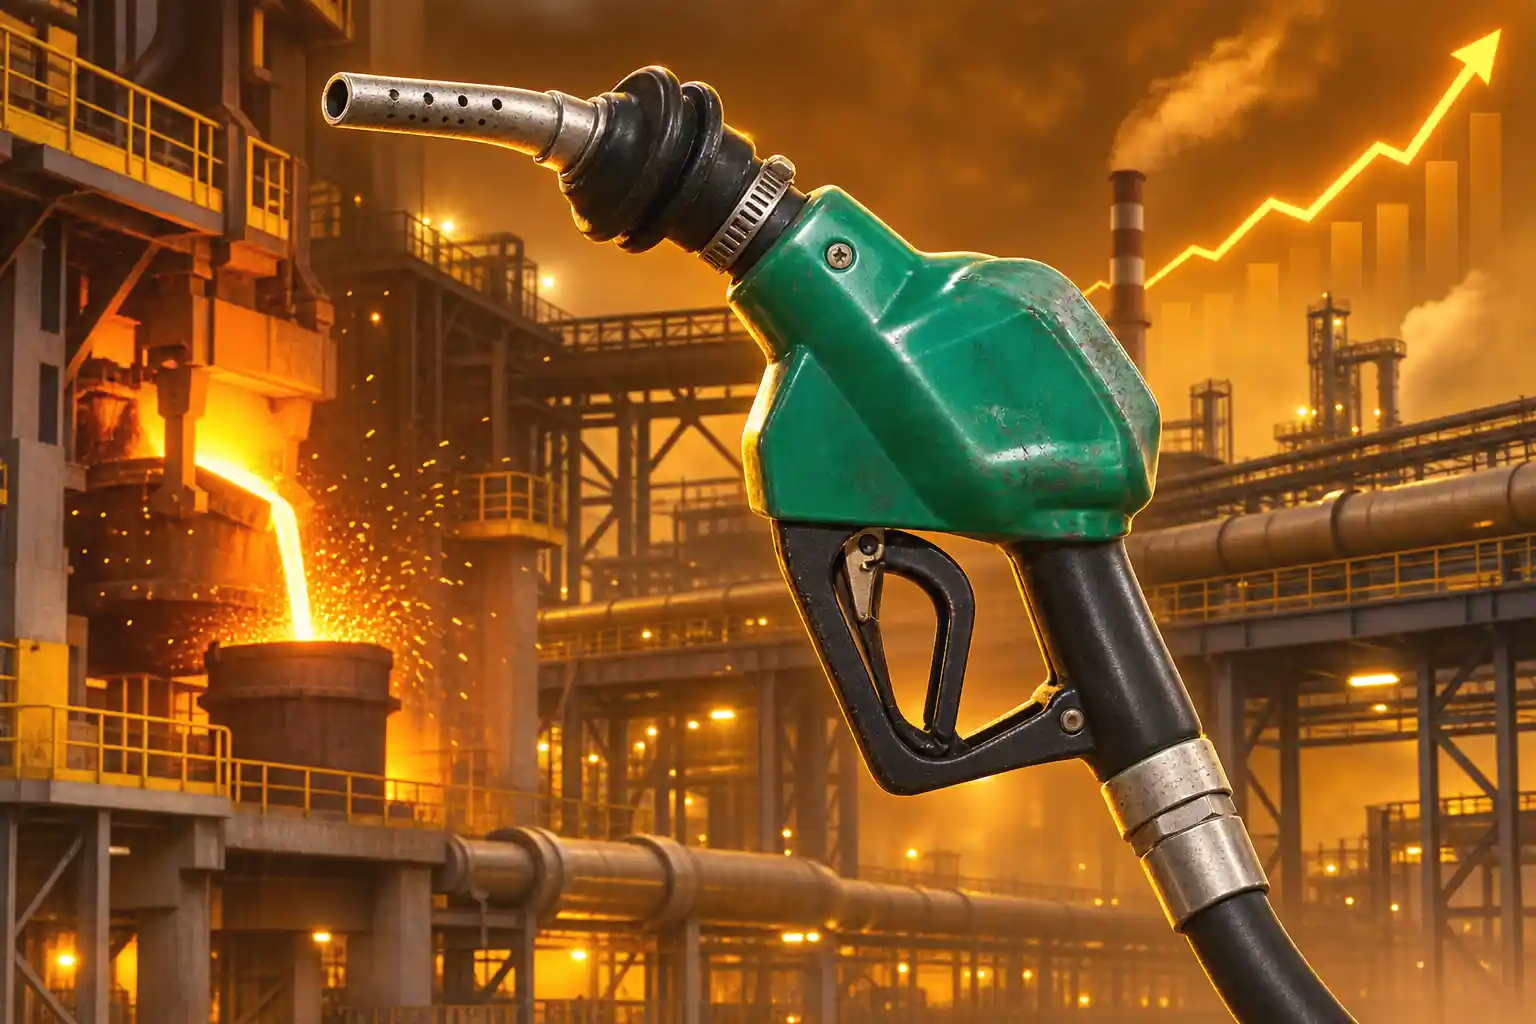
Fuel and Power Did Almost All of the Climb
Fuel and power inflation rose to 32.84 percent from 25.85 percent. Crude petroleum and natural gas ran at 70.80 percent after 57.32 percent. Mineral oils, the petroleum-products line and the heavy weight inside the group, ran at 45.57 percent after 40.02 percent. Coal and lignite rose to 10.49 percent from 9.31 percent.
Electricity flipped. It had contracted 0.43 percent in September and printed 8.06 percent in October, with the index up to 96.5 from 92.0. That is the administered-price line that had been holding down the fuel group, and it joined the climb in the same month crude and mineral oils accelerated.
FUEL AND POWER INSIDE THE OCTOBER WPI
| Group | Weight % | Oct index | Sep index | Oct YoY % | Sep YoY % |
|---|---|---|---|---|---|
| Fuel and power | 14.11 | 115.7 | 110.5 | 32.84 | 25.85 |
| Mineral oils | 8.19 | 124.9 | 119.3 | 45.57 | 40.02 |
| Electricity | 4.46 | 96.5 | 92.0 | 8.06 | -0.43 |
| Coal and lignite | 0.74 | 96.9 | 95.1 | 10.49 | 9.31 |
| Crude petroleum and natural gas | 0.72 | 148.6 | 141.9 | 70.80 | 57.32 |
Mineral oils alone outweigh crude inside the index, so pump and industrial-fuel products, not the tiny crude weight, do the arithmetic damage. Combined with the electricity turn, the fuel group became the monthly WPI.
What the Trial Input Gauge Shows for Plants
The trial Input Producer Price Index for manufacturing, a companion series in the same release, rose to 108.2 in October from 106.1 in September. That gauge tracks what plants pay for materials. In the same month the wholesale manufactured-products index did not move, the input gauge did.
Coke and refined petroleum products on the input side jumped to 103.1 from 94.7. Chemicals rose to 114.5 from 113.4, and basic metals to 104.8 from 103.4. Rubber and plastic inputs rose to 117.6 from 115.5. The Output PPI for manufactured products, a factory-gate selling-price cousin of WPI, only moved to 111.7 from 111.0.
FACTORY INPUTS VERSUS FACTORY OUTPUT
| Measure | September | October |
|---|---|---|
| Manufactured products WPI index | 110.2 | 110.2 |
| Trial Input PPI, manufacturing | 106.1 | 108.2 |
| Coke and refined petroleum (input) | 94.7 | 103.1 |
| Chemicals (input) | 113.4 | 114.5 |
| Basic metals (input) | 103.4 | 104.8 |
| Output PPI, manufactured products | 111.0 | 111.7 |
The gap between a 12.29 percent wholesale print and shop inflation running about half as fast is a cost squeeze on firms that cannot pass the fuel bill through. Plants bought a more expensive barrel, a more expensive chemical slate and a more expensive metal slate, then posted the same manufactured WPI as in September.
While manufactured products inflation has moderated marginally, the persistence of elevated input costs could influence production costs and business pricing decisions in the coming months.
Anil Gupta, President, PHD Chamber of Commerce and Industry
Gupta is speaking for the party that actually buys the October basket. The household index the central bank targets is a different object, and it moved less.
Metals, Chemicals and the Rest of the Cost Stack
Even with the manufactured index frozen on the month, the annual rates on core industrial inputs stayed hot and, in several cases, rose. These are the lines that feed into auto parts, packaging, construction steel, paints, fertiliser and plastics, whether or not a consumer sees them on a shelf.
THE INDUSTRIAL COST STACK IN OCTOBER
- Crude petroleum and natural gas: Inflation rose to 70.80 percent from 57.32 percent, with the index at 148.6.
- Mineral oils: Petroleum products ran at 45.57 percent, up from 40.02 percent, the main fuel weight.
- Chemicals and chemical products: Inflation rose to 17.53 percent from 16.74 percent, index 106.6.
- Basic metals: Inflation rose to 17.21 percent from 16.96 percent, index 106.9.
- Rubber and plastic products: Inflation rose to 13.90 percent from 13.47 percent.
- Electricity: The index flipped from a 0.43 percent fall to 8.06 percent inflation.
Textiles eased to 13.67 percent from 13.85 percent, so not every factory line reheated. Motor vehicles inflation was 4.35 percent after 4.46 percent. The pressure is concentrated in energy and in the materials that energy pulls with it, which is why a 63.13 percent manufactured basket can look calm on the month while a chemicals plant or a rolling mill does not.
Households Faced a 6.09 Percent Retail Print
Shop prices are the series that sets policy. The Ministry of Statistics and Programme Implementation, on November 12, printed retail inflation of 6.09 percent for October, up from 5.54 percent in September. Rural inflation was 6.63 percent and urban 5.41 percent. Consumer food inflation, on the Consumer Food Price Index, rose to 8.94 percent from 7.74 percent.
That 6.09 percent combined print sits above the upper edge of the 4 percent retail inflation target the government renewed on March 25, 2026, a 2 to 6 percent band that runs through March 2031 and is defined on the consumer index, not on WPI. Wholesale inflation in October ran about twice the retail rate, a 6.20 percentage point gap.
The baskets explain most of the split. Fuel and power is 14.11 percent of WPI. In CPI, electricity, gas and other fuels weigh 5.36 percent and inflated 3.71 percent. The broader housing, water, electricity, gas and other fuels group, 17.66 percent of CPI, inflated 2.90 percent. Transport in CPI was 5.84 percent. Households are not buying crude at the wholesale index, and listed fuel retailers have not moved pump prices one-for-one with mineral oils at 45.57 percent.
They are, however, buying food, and that is where the two prints refuse to rhyme.
The Farm-to-Shop Split in Food Prices
The WPI food index, 24.99 percent of the wholesale basket, eased to 8.58 percent from 8.66 percent. Its index actually fell, to 120.2 from 120.4. Primary food articles eased on the month to 121.9 from 122.2, even as their annual rate edged up to 8.26 percent from 8.14 percent. Manufactured food products held at 117.1, with inflation down to 9.24 percent from 9.44 percent.
Retail food went the other way. The consumer food index rose to 8.94 percent from 7.74 percent. Onions, a small CPI weight at 0.70 percent, inflated 116.22 percent after 108.13 percent. Potatoes deflated 14.24 percent. The kitchen print is a mix of a few exploding items and a few falling ones, and it is not the same mix as the wholesale food index.
So October produced two food stories at once. Wholesale food cooled a touch, which takes heat out of the WPI headline that fuel had put in. Retail food heated up, which is what households and the Reserve Bank of India actually eat. Factories took the fuel shock. Shoppers took the onion shock. Neither print is a clean read of the other.
April to October Already Averages 10.14 Percent
October was the third straight monthly increase after a dip in July, and the second straight double-digit reading. The six-month annexure in the ministry release runs from a 9.88 percent final rate in May to 12.29 percent in October. August was finalised at 9.92 percent, with the index unchanged at 110.8. September broke into double digits at 11.39 percent. October extended that break.
THE SIX-MONTH WHOLESALE PRINT
- May 2026: Inflation prints 9.88 percent, index 110.1.
- June 2026: Inflation prints 9.97 percent, index 110.3.
- July 2026: Inflation dips to 9.78 percent, index 110.0.
- August 2026: Final inflation is 9.92 percent, index 110.8.
- September 2026: Inflation jumps to 11.39 percent, index 112.5.
- October 2026: Inflation prints 12.29 percent, index 113.3.
The April to October average is already 10.14 percent, against -0.30 percent in the same stretch of 2025-26 and 1.71 percent in 2024-25. Fuel and power averages 26.37 percent over those seven months. Manufactured products average 8.37 percent. The government posts item-wise wholesale index files from April 2023 on the Office of Economic Adviser site, on the 2022-23 base used for this series.
Rahul Agrawal, principal economist at ICRA, expects the WPI rate to cool to about 11.6 percent in November and to average 11.5 percent in the December quarter, then to fall to single digits in the three months through March 2027. That path still leaves factories inside a double-digit input year for one more quarter. The next provisional WPI, Output PPI and trial Input PPI, for November, are due on Monday, December 14, 2026. October’s 110.2 on manufactured output will be the baseline for whether plants started to pass the fuel bill on, or ate another month of it.
Frequently Asked Questions
Who Publishes India’s Wholesale Price Index?
The Office of the Economic Adviser in the Department for Promotion of Industry and Internal Trade, under the Ministry of Commerce and Industry, compiles WPI, the Output PPI and the trial Input PPI. October’s provisional WPI used a weighted response rate of 81.1 percent; the final August index used 99.37 percent.
What Is the Trial Input Producer Price Index?
It is an experimental manufacturing-sector index, published from March 2026, that tracks input prices at NIC two-digit industry level rather than the prices plants charge for output. The all-manufacturing trial index was 108.2 in October after 106.1 in September, and August was revised to 105.1 from a provisional 104.2.
When Are WPI and CPI Figures Released Each Month?
Provisional WPI, Output PPI and trial Input PPI for a given month come out on the 14th of the following month, or the next working day if the 14th is not a working day. The October 2026 CPI, on a 2024=100 base, was released on November 12, with November CPI also due on December 14, 2026.
What Base Year Does the Current WPI Series Use?
The current series uses 2022-23=100, and monthly item-level indices on that base are available from April 2023. Older RBI handbook tables still carry the 2011-12 base beside it, so annual rates from mixed bases should not be chained as if they were one series.

Xiaomi 18 Pro Goes Global as Its Privacy Filter Falters

iFixit Finds HomeView Glued Shut After Repair Gains

Polymetallic Nodules Shelter 4,139 Animals Miners Want

One UI 9.5 Puts Now Brief Behind a System Agent

Framework’s $99 Keyboard Brings Laptop Repair to the Couch

Microsoft 365 Auth Fault Took Down Exchange and Teams

OpenClaw 2.0 Ships a Team Workplace With Host-Trust Defaults

Xbox Caps Game Pass Cloud Gaming at 15 Hours

OpenAI Unveils GPT-6 Astra With a Critical Cyber Label

Squishy Dumpling Toys Recalled After Hiding Illegal Water Beads
-
 NEWS3 months ago
Microsoft 365 Auth Fault Took Down Exchange and Teams
-
 GAMING3 months ago
Xbox Caps Game Pass Cloud Gaming at 15 Hours
-
 NEWS3 months ago
OpenClaw 2.0 Ships a Team Workplace With Host-Trust Defaults
-
 NEWS3 months ago
OpenAI Unveils GPT-6 Astra With a Critical Cyber Label
-
 LIFESTYLE3 months ago
Squishy Dumpling Toys Recalled After Hiding Illegal Water Beads
-

 BUSINESS3 months ago
Diesel Breaks Its Record as the White House Claims Credit
-

 NEWS3 months ago
IFA 2026’s Weird Gadgets Are Building a Sensor Home
-
 BUSINESS3 months ago
ChargePoint Stock Rally Prices Wilmer’s Three-Year Cash Plan