
AUTO
New-Car Prices Hit $51,109 as Everyday Buyers Step Back
Kelley Blue Book’s $51,109 October average is mix, not a $51,000 floor. Pickups lift the print; first-time buyers face $27,235 used cars and 84-month loans.

The average new-vehicle transaction price in the U.S. reached a record $51,109 in October, according to Kelley Blue Book.
Cox Automotive published the print on November 10. It is $649 above a revised September average of $50,460, and 2.1% above October 2025. That yearly gain sits below the 3.6% October pace the firm treats as normal. The people still shopping paid more. The people who need a cheap first car found less of one.
A $51,109 Average Built on Mix
Kelley Blue Book’s average is the product price paid before incentives, taxes and fees. Incentives averaged $3,490 in October, or 6.8% of that figure, up about $130 from September and $252 from a year earlier. The record $51,109 in October still cleared the previous high of $50,614, set in December 2025, by $495.
The sticker average, or MSRP, rose to $52,933, up 1.4% from September and 2.4% from a year earlier. Cox said a typical October MSRP gain is 3.3%. Incentive spend ticked up, yet it remains below long-run averages, which is a sign dealers are not dumping stock to chase volume.
Five segments did most of the selling. Midsize SUVs, compact SUVs, full-size pickups, subcompact SUVs and compact cars accounted for 64.4% of October volume. Midsize SUVs took the top spot from compact SUVs, with sales up close to 10% from a year earlier. Three of those five segments transacted well below the headline average.
OCTOBER’S FIVE BIGGEST SEGMENTS
| Segment | Avg. price paid | Change from Oct. 2025 |
|---|---|---|
| Midsize SUV | $50,570 | +1.9% |
| Compact SUV | $37,895 | +4.3% |
| Full-size pickup | $67,912 | +1.4% |
| Subcompact SUV | $31,333 | +1.9% |
| Compact car | $28,030 | +3.4% |
Vehicles priced from about $28,000 to $38,000 gained 9.6% in volume year over year, Cox said. Compact SUVs posted the sharpest price gain among the five, at 4.3%. The $51,109 print is what you get when those cheaper units share the lot with $67,912 pickups.
Full-Size Pickups Still Fetch $67,912
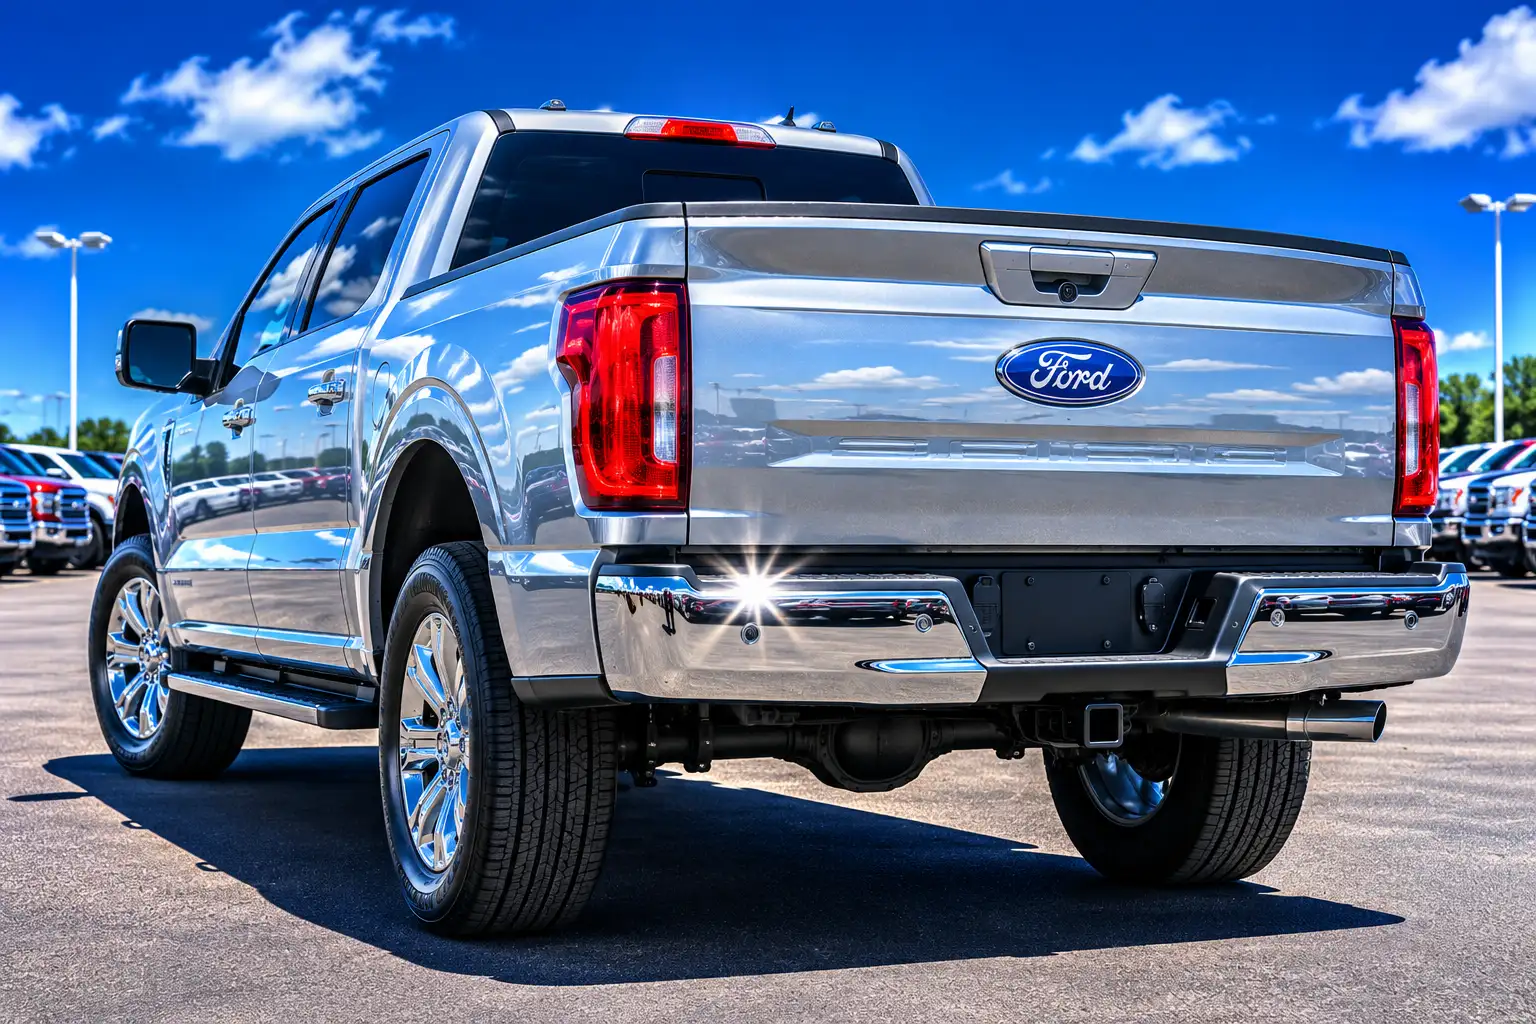
Full-size pickups remain the heaviest weight on the average. Their October transaction price was $67,912, up 1.4% from a year earlier. Full-size SUVs transacted at $80,957. Ram’s average was $69,850, up 6.5% year over year. Ford brand deals averaged $61,565, up 6.2%. Ford Motor Company as a group sat at $62,326, up 6.5%.
Stellantis, which includes Jeep, Ram, Dodge and Chrysler, averaged $59,947, up 9.2% from October 2025, the largest yearly jump among the major groups in Cox’s tables. Lincoln, Ford’s luxury line, averaged $78,132, up 11.3%. Cadillac averaged $90,101, up 6.6%.
Those trucks and luxury crossovers are the vehicles U.S. makers have spent a decade leaning into. They carry higher prices and, for the factories, better margins than the compact sedans that used to pull shoppers onto the lot. The October mix rewarded that bet. It also pulled a national average through $51,000 even as compact cars still changed hands at $28,030.
Electric vehicles did not set the record. A new EV averaged $56,220 in October, up 1% from September but down 2.7% from a year earlier. EV incentives equaled 11.3% of that average, well above the industry’s 6.8%. Tesla’s average was $54,194. Cox estimated 1,914 Cybertruck sales in October, the strongest month in more than a year, at an average of $92,380.
What Compact Cars Sold For
Erin Keating, the Cox Automotive executive analyst who co-authored the report, put the split in one line. Shoppers are still buying plenty of vehicles well below the headline number. The average is following the mix.
The average is telling us as much about product mix as it is about affordability. Three of the five highest-volume segments transacted significantly below the industry’s $51,109 average, while vehicles priced from roughly $28,000 to $38,000 collectively gained 9.6% in volume year over year. Consumers are still buying plenty of vehicles well below the headline average transaction price, even as strong demand for full-size pickups and other larger, well-equipped vehicles keeps pushing the average to new highs.
Erin Keating, Executive Analyst, Cox Automotive
A compact car averaged $28,030 in October, up 3.4% from $27,110 a year earlier. A subcompact SUV averaged $31,333. Those are real transaction prices, not clearance fantasies, and they are the units that gained volume. They are also thousands of dollars above where a first car used to start.
The leftover subcompact-car category shows what happens when the cheap ones leave. That slice averaged $38,423 in October, up 49.5% from $25,707 a year earlier. The jump is mix, not a 50% sticker on the same hatchback. Nissan ended U.S. production of the Versa in December 2025, and that was the last new car sold here under $20,000. Roundups of remaining base models now start in the low $20,000s, before destination, options and the trims most buyers actually take home.
Honda, Mazda and Subaru Hold the Lower Aisle
The brand table makes the same split. Honda’s October average was $38,198, up 0.8% from a year earlier. Mazda sat at $37,082, up 5.2%. Subaru averaged $37,429, up 3.6%. Mitsubishi, the lowest make Cox listed, averaged $33,579. Kia averaged $39,260, up 7.8%. Hyundai averaged $38,320.
Those names still transact in the high $30,000s. They are not $51,000 cars. They also sit far above the old compact-sedan floor, and they are competing for a smaller pool of new-car households. Keating has said about 16 million people buy new vehicles in a typical year, roughly 1 million fewer than before the pandemic, with more of the remaining buyers older and better able to pay.
WHERE THE OCTOBER AVERAGES LANDED
- Mitsubishi: $33,579, the lowest make in Cox’s table, down 2.2% from September.
- Mazda: $37,082, up 5.2% from October 2025, still well under the industry print.
- Honda: $38,198, almost unchanged from September and up 0.8% year over year.
- Subaru: $37,429, up 3.6% from a year earlier.
- Ford: $61,565, a $23,000-plus gap over Honda on the same lots.
- Ram: $69,850, up 6.5%, sitting next to the full-size pickup average of $67,912.
Toyota brand deals averaged $44,168, up 3.4%. Toyota Motor Corporation as a group, including Lexus, averaged $47,118. Those are closer to the national print because the mix includes more crossovers. The lower aisle is still there. It is narrower, and it is no longer cheap.
The Tightest Corner of the Used Lot
Used vehicles are supposed to be the escape hatch. In September they listed at Cox’s average used-vehicle listing price of $27,235, the highest monthly average since December 2022 and about 6% above a year earlier. That is the same neighborhood as a new compact car’s $28,030 transaction price, before the used car’s mileage and the new car’s warranty are even compared.
THE USED LOT IN SEPTEMBER
- Listing price: $27,235, essentially flat from a revised $27,223 in August and the third month of 2026 above $27,000.
- Stock on hand: 2.21 million used vehicles, up 3.3% from a year earlier and up 3.9% from August.
- Days’ supply: 49 days, up from 44 in August, as inventory rose while the sales pace fell 6.3% from August.
- Cheap band: Vehicles listed below $15,000 were 15.7% of inventory, down from 19.4% a year earlier, with only 34 days of supply.
The cheap band is the one that moved the wrong way. Supply of used vehicles priced below $15,000 fell 16.2% year over year. Lots got fuller. The cars a first-time buyer can actually write a check for got scarcer. Cox’s Scott Vanner, manager of economic and industry insights, noted that credit access improved in September even as borrowing costs rose, and that deal structures have grown more complicated as buyers stretch to get in.
Ivan Drury, director of insights at Edmunds, has said the person he worries about most is the first-time buyer, who faces a steep down payment with nothing to trade. People who already own a car can still use that equity to move up. People who do not own one meet a used average near $27,235 and a new compact near $28,030, then a loan.
One in Four New Loans Now Lasts Seven Years
The cash price is only half of what households feel. Edmunds’ third-quarter figures, released October 1, show buyers borrowed a record $44,664 on a new vehicle, up from $42,744 a year earlier. The average monthly payment hit $787, up from $756. The average down payment fell to $5,554 from $6,021. The average rate did not move. New-vehicle APR held at 7.0% for a third straight quarter.
What moved was time. Loans of 84 months or longer were 25.5% of financed new-vehicle purchases, up from 21.8% a year earlier. The average term was 70.5 months. Average interest over the life of a new-vehicle loan reached $9,938, up from $9,442, a $496 increase with no rate increase. Among buyers already paying $1,000 or more a month, 69% chose terms of 72 months or longer. One in five financed new-vehicle purchases, 21.2%, carried a payment of $1,000 or more.
Q3 2026 LOANS, NEW VS. USED
| Measure | New vehicle | Used vehicle |
|---|---|---|
| Amount financed | $44,664 | $30,703 |
| Monthly payment | $787 | $582 |
| APR | 7.0% | 10.6% |
| Down payment | $5,554 | $3,865 |
| Average term | 70.5 months | 70.4 months |
Used-car paper is worse on the rate. Shoppers financed $30,703 at 10.6% APR and $582 a month, with $3,865 down. Drury’s warning sits on the new-car side, where the dollar amounts are larger.
When buyers are already financing nearly $45,000 and taking on another nearly $10,000 in interest, it’s critical to think beyond whether the monthly payment works today and consider what you’re committing to over the full life of the loan.
Ivan Drury, Director of Insights, Edmunds
Jessica Caldwell, Edmunds’ head of insights, called the stretch a show of resilience: households are putting more of the budget toward the vehicle and shopping the loan instead of walking away. The other reading is simpler. A $51,109 average would strand more buyers if the term still stopped at five years. Seven-year paper is how the remaining crowd clears the payment, and it is how $9,938 of interest becomes part of the price.
Thin Discounts Meet a Smaller Retail Crowd
Cox said incentive spending rose only modestly in October and remains below long-term averages. That is the tell on who holds the pricing power. Automakers and dealers are not chasing a sale hard enough to knock the average off its high, even after October’s selling pace missed the firm’s own forecast and ran at its slowest clip since January.
Keating has described a pie that is not growing. Rivals steal share from each other instead of counting on new households walking in. Buyers in their late 30s and early 40s are holding cars longer, she said, under other household bills. Older drivers are keeping licenses longer, and more buyers 65 and up are in the market than before. The people still transacting can pay $61,565 for a Ford or $67,912 for a full-size pickup. The people who need the old $20,000 door are on the used lot, where the sub-$15,000 band is 15.7% of stock.
The long view makes the same point. Cox’s series fell to $38,550 in February 2020, just before the pandemic shut factories and dealers began prioritizing the trucks that print more money. October’s $51,109 is $12,559 above that low. A 2.1% yearly gain can sit below inflation and still leave a first-time buyer staring at a $27,235 used listing, a $5,554 down payment, and a 70.5-month note.
The October record will move again next month. The split underneath it is slower to move: pickups and midsize SUVs on one side of $51,109, compact cars and the used cheap band on the other, and a quarter of new-car loans now running seven years so the payment still fits.
Disclaimer: This article is news reporting on published price and loan figures from Kelley Blue Book, Cox Automotive and Edmunds. It is informational only and is not a recommendation to buy, sell, lease or finance any vehicle. It does not constitute investment, lending or personal-finance advice, and it does not compare specific loan offers, credit tiers or dealer deals. Readers should speak with a qualified financial counselor, credit union or bank lender, and review the full contract terms, before taking on an auto loan or trading a vehicle. Averages, rates and inventory figures reflect the named monthly and quarterly reports and can change with the next print.

Xiaomi 18 Pro Goes Global as Its Privacy Filter Falters

iFixit Finds HomeView Glued Shut After Repair Gains

Polymetallic Nodules Shelter 4,139 Animals Miners Want

One UI 9.5 Puts Now Brief Behind a System Agent

Framework’s $99 Keyboard Brings Laptop Repair to the Couch

Microsoft 365 Auth Fault Took Down Exchange and Teams

OpenClaw 2.0 Ships a Team Workplace With Host-Trust Defaults

Xbox Caps Game Pass Cloud Gaming at 15 Hours

OpenAI Unveils GPT-6 Astra With a Critical Cyber Label

Squishy Dumpling Toys Recalled After Hiding Illegal Water Beads
-
 NEWS3 months ago
Microsoft 365 Auth Fault Took Down Exchange and Teams
-
 GAMING3 months ago
Xbox Caps Game Pass Cloud Gaming at 15 Hours
-
 NEWS3 months ago
OpenClaw 2.0 Ships a Team Workplace With Host-Trust Defaults
-
 NEWS3 months ago
OpenAI Unveils GPT-6 Astra With a Critical Cyber Label
-
 LIFESTYLE3 months ago
Squishy Dumpling Toys Recalled After Hiding Illegal Water Beads
-

 BUSINESS3 months ago
Diesel Breaks Its Record as the White House Claims Credit
-

 NEWS3 months ago
IFA 2026’s Weird Gadgets Are Building a Sensor Home
-
 BUSINESS3 months ago
ChargePoint Stock Rally Prices Wilmer’s Three-Year Cash Plan